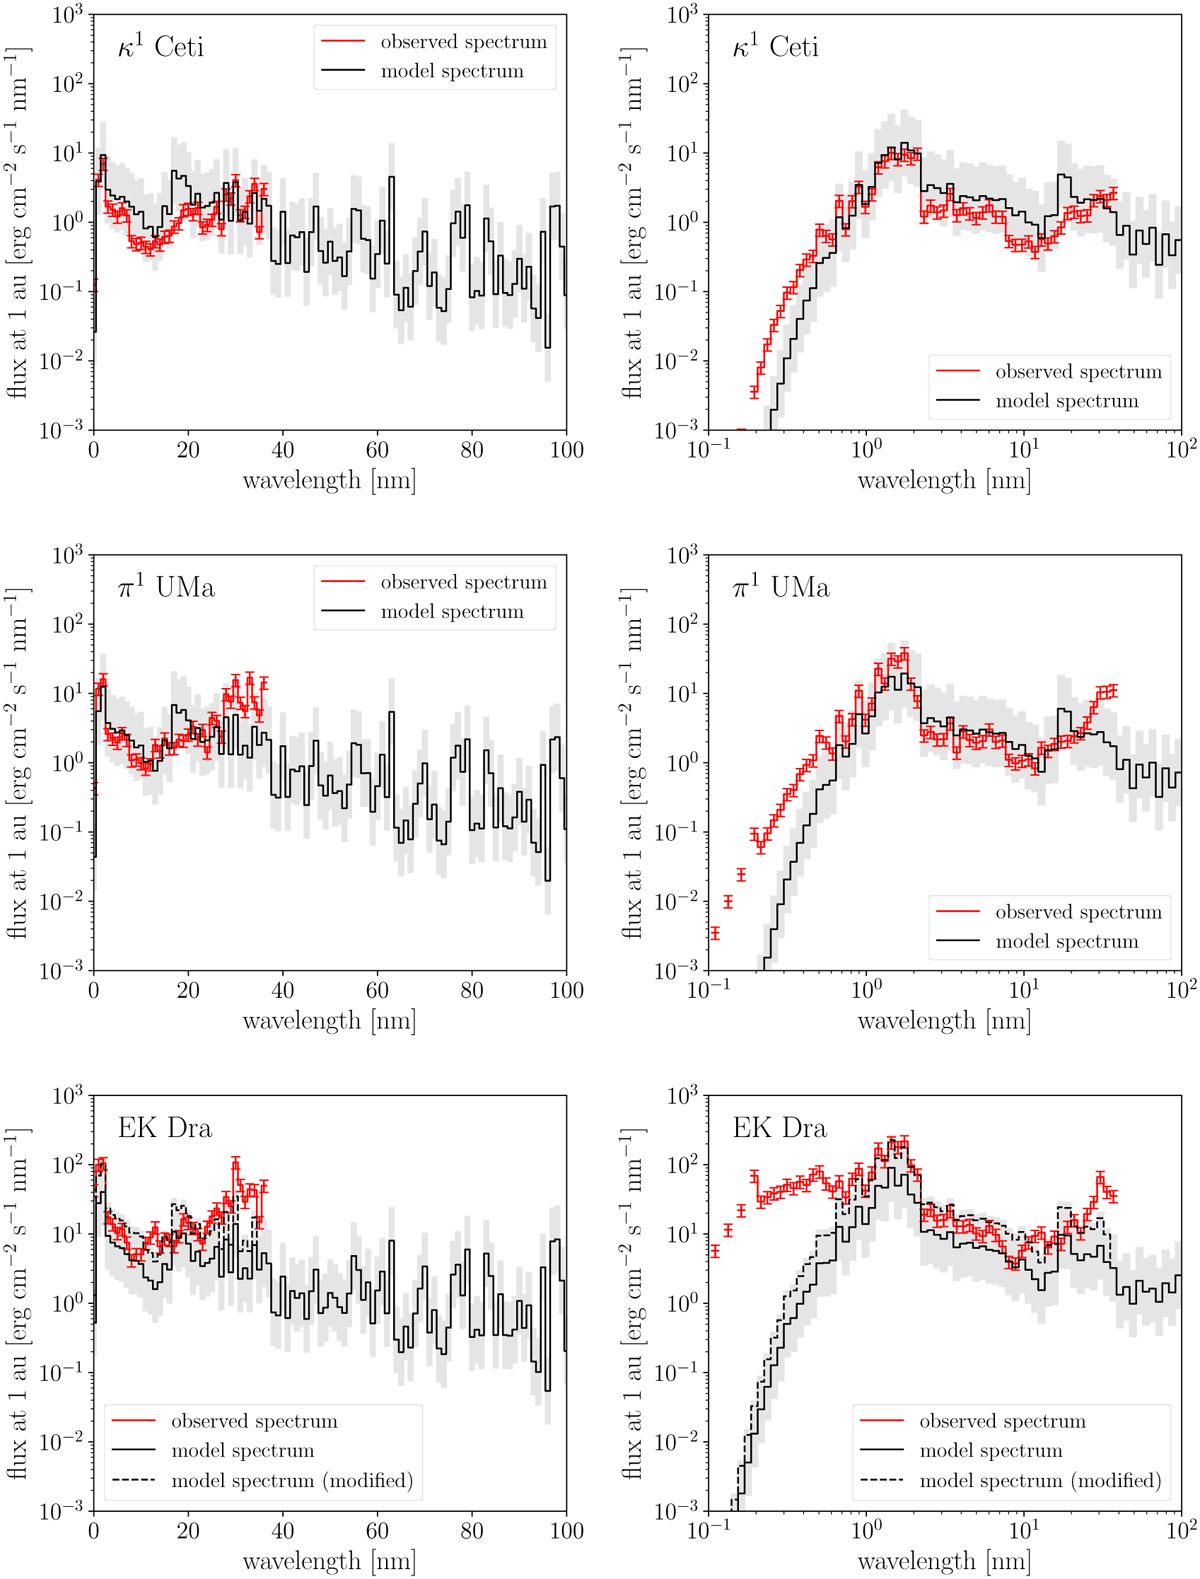
Fig. 8
Download original image
Comparison of the model spectra (solid black line) and observed spectra (red symbols) of young solar-type stars (top κ1 Ceti; middle π1 UMa; and bottom EK Dra). The left side shows the bin-averaged spectra on a linear scale, while the right side shows them on a logarithmic scale. The bin size definition follows Fig. 3. The grey area represents the uncertainty of the model (factor of 3). The dashed black lines in the bottom panels indicate the spectrum after correction for the underestimation due to the insufficient resolution of the transition region (see the text for details).
Current usage metrics show cumulative count of Article Views (full-text article views including HTML views, PDF and ePub downloads, according to the available data) and Abstracts Views on Vision4Press platform.
Data correspond to usage on the plateform after 2015. The current usage metrics is available 48-96 hours after online publication and is updated daily on week days.
Initial download of the metrics may take a while.