Fig. 1.
Download original image
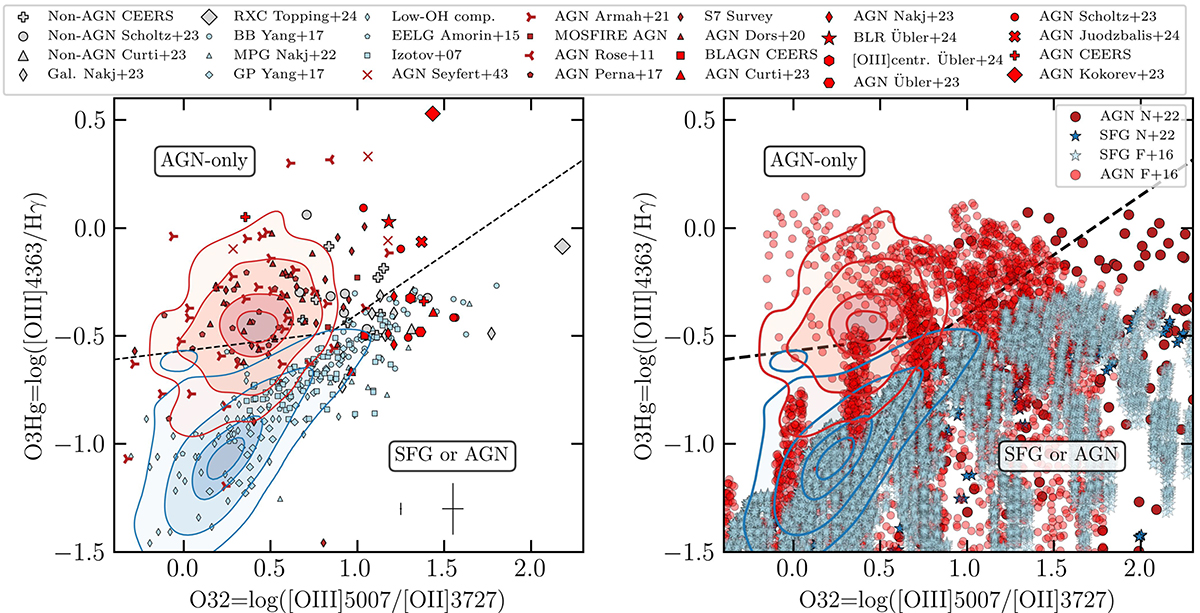
Diagnostic diagram showing the [OIII]λ4363/Hγ vs [OIII]λ5007/[OII]λ3727 line ratios. [OII]λ3727 is the sum of the doublet [OII]λλ3726, 3728. Left panel: Plot of all the observational samples described in Sects. 2.1 and 2.2. Red is for AGN, blue for low-z SFGs, and grey for high-z sources not classified as AGN (see legend for shapes). The red and blue contours show the distribution at SDSS AGN and SFGs, respectively, including the 90%, 70%, 30%, and 10% of the populations. Right panel: Same plot, but showing the AGN and SFG models computed by Gutkin et al. (2016), Feltre et al. (2016), and Nakajima & Maiolino (2022), as described in Sect. 2.3. The tracks of the AGN and SFG models according to log U and Z are shown in Fig. B.1. The black dashed line indicates the demarcation defined in Sect. 3.4. The distribution of models and of observational samples both suggest that the dominant ionizing source in galaxies above the demarcation line is AGN. The error bars reported in the lower right corner represent the median errors of the low-redshift (left) and high-redshift (right) samples. The effect of dust attenuation on this diagnostic moves sources towards the right, without contaminating the AGN-only region with SFGs.
Current usage metrics show cumulative count of Article Views (full-text article views including HTML views, PDF and ePub downloads, according to the available data) and Abstracts Views on Vision4Press platform.
Data correspond to usage on the plateform after 2015. The current usage metrics is available 48-96 hours after online publication and is updated daily on week days.
Initial download of the metrics may take a while.