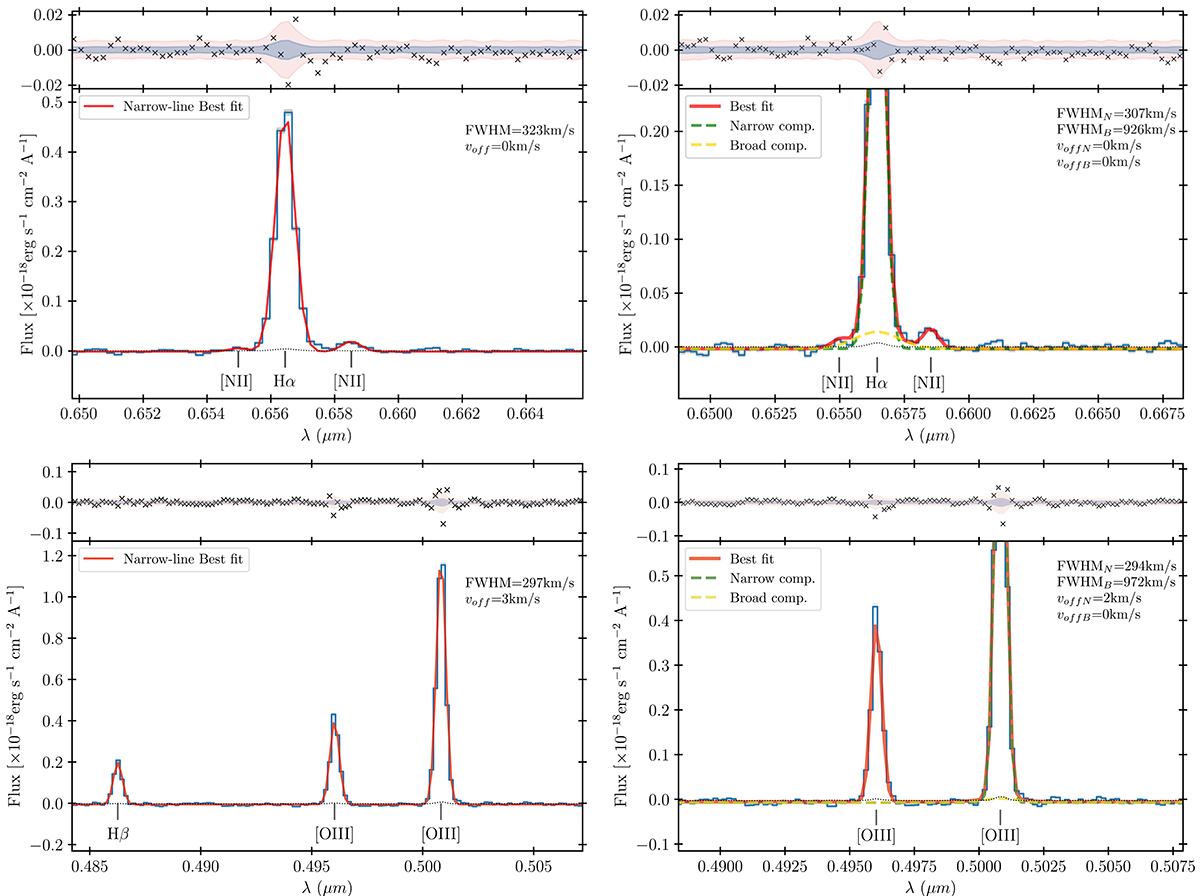
Fig. 4.
Download original image
Different fits of the spectrum derived from the stack of the sources not identified as AGN in the literature, but lying in the AGN region of the diagnostic diagrams presented in Sect. 3. The stacked spectrum in these plots is resampled at the best resolution among those of the single spectra involved (i.e. ∼100km/s), but the results do not change considering the worst resolution (i.e. ∼150km/s). Top panels: Fit of the Hα and [N II] complex with only a narrow component (left) and adding a broad component to the Hα line (right). The global fit is presented in red, while the narrow and broad Hα components are in green and yellow, respectively. In the upper panel are shown the residuals of the fit compared with the distribution of the 1σ (blue) and 3σ (red) errors on the fluxes. In the upper right part of the plots are reported the FWHM and the velocity offset of the different components considered in the fits. Lower panels: Same as above, but for the Hβ and [O III] λλ4959, 5007 doublet complex. In particular, on the right, we added to the fit of the [OIII]λ5007 a broad component with the same FWHM and velocity offset as the broad component of the Hα, but here it is not required by the fit.
Current usage metrics show cumulative count of Article Views (full-text article views including HTML views, PDF and ePub downloads, according to the available data) and Abstracts Views on Vision4Press platform.
Data correspond to usage on the plateform after 2015. The current usage metrics is available 48-96 hours after online publication and is updated daily on week days.
Initial download of the metrics may take a while.