Fig. B.1.
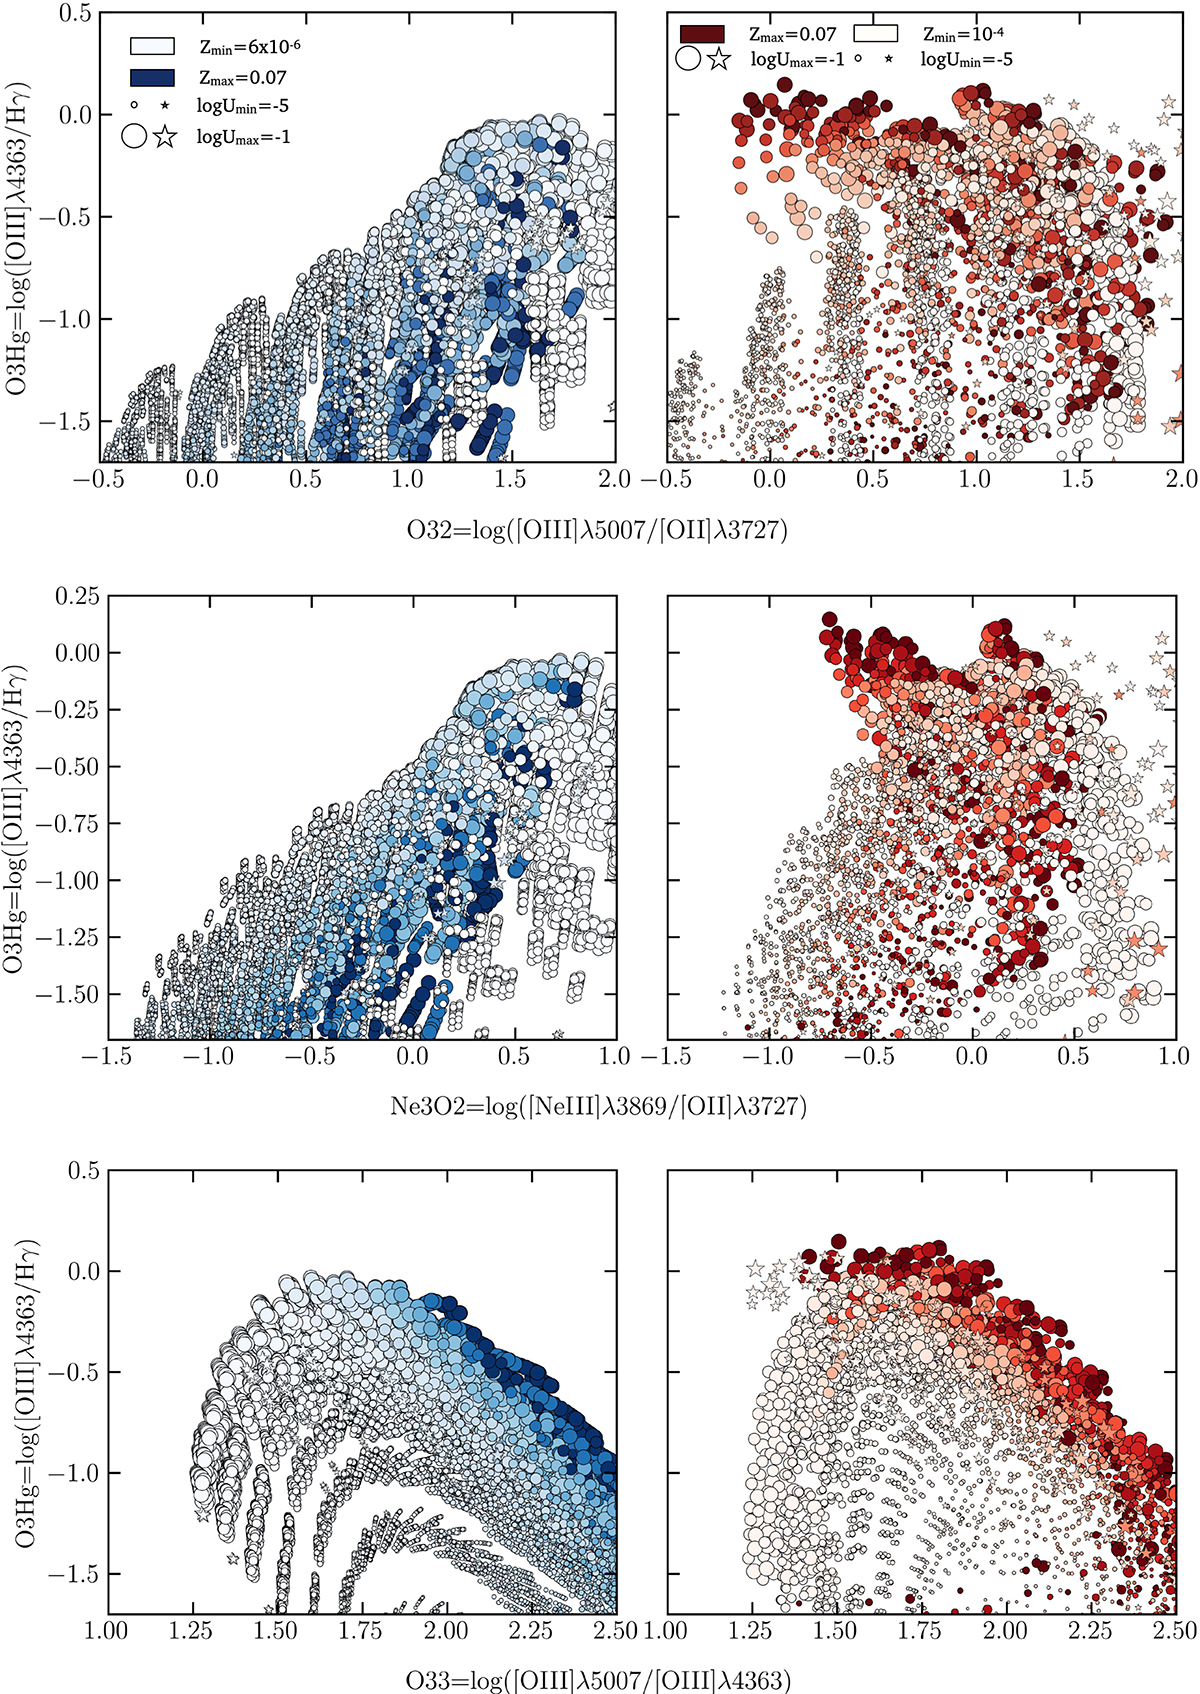
Download original image
Distribution of the photoionization models computed in Feltre et al. (2016) (circles) and Nakajima & Maiolino (2022) (stars) with respect to the line ratios reported in Fig. 1 (top panel), Fig. 2 (central panel), and Fig. 3 (bottom panel). The photoionization models for SFG are reported on the right, while the AGN models are on the left. The points are colour-coded according to their metallicity (the stronger the colour, the higher the metallicity), and the marker size depends on the ionization parameter (the larger the marker, the higher the ionization parameter). The maximum and minimum values of Z and log U for the two classes of models are reported in the top part of the top panels.
Current usage metrics show cumulative count of Article Views (full-text article views including HTML views, PDF and ePub downloads, according to the available data) and Abstracts Views on Vision4Press platform.
Data correspond to usage on the plateform after 2015. The current usage metrics is available 48-96 hours after online publication and is updated daily on week days.
Initial download of the metrics may take a while.