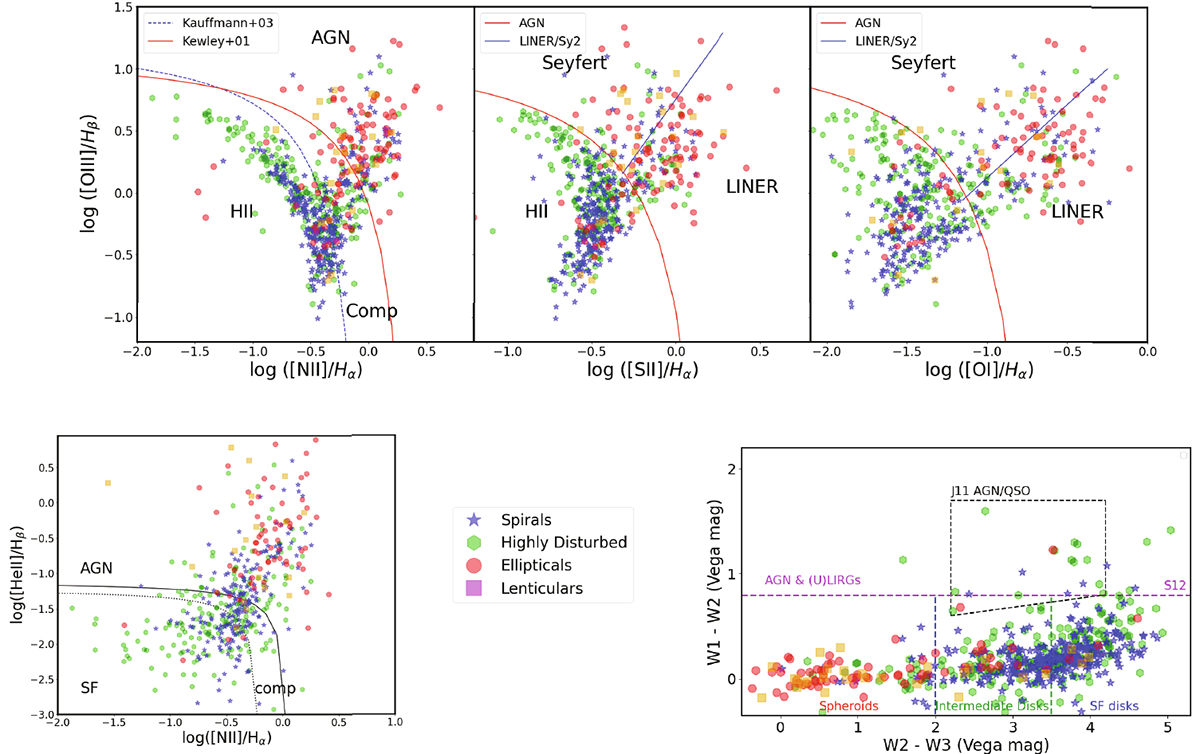
Fig. 11.
Download original image
Top: BPT diagnostic diagrams of the sub-sample that shows emission lines. Separations are shown in the legends. Bottom-left: Diagnostic diagram based on the HeII emission line. Separations defined by SB12. Bottom-right: WISE colour-colour diagram. Separations defined by J11 and S12. Mergers in the different panels are coloured by their morphology as shown in the legend.
Current usage metrics show cumulative count of Article Views (full-text article views including HTML views, PDF and ePub downloads, according to the available data) and Abstracts Views on Vision4Press platform.
Data correspond to usage on the plateform after 2015. The current usage metrics is available 48-96 hours after online publication and is updated daily on week days.
Initial download of the metrics may take a while.