Fig. 5.
Download original image
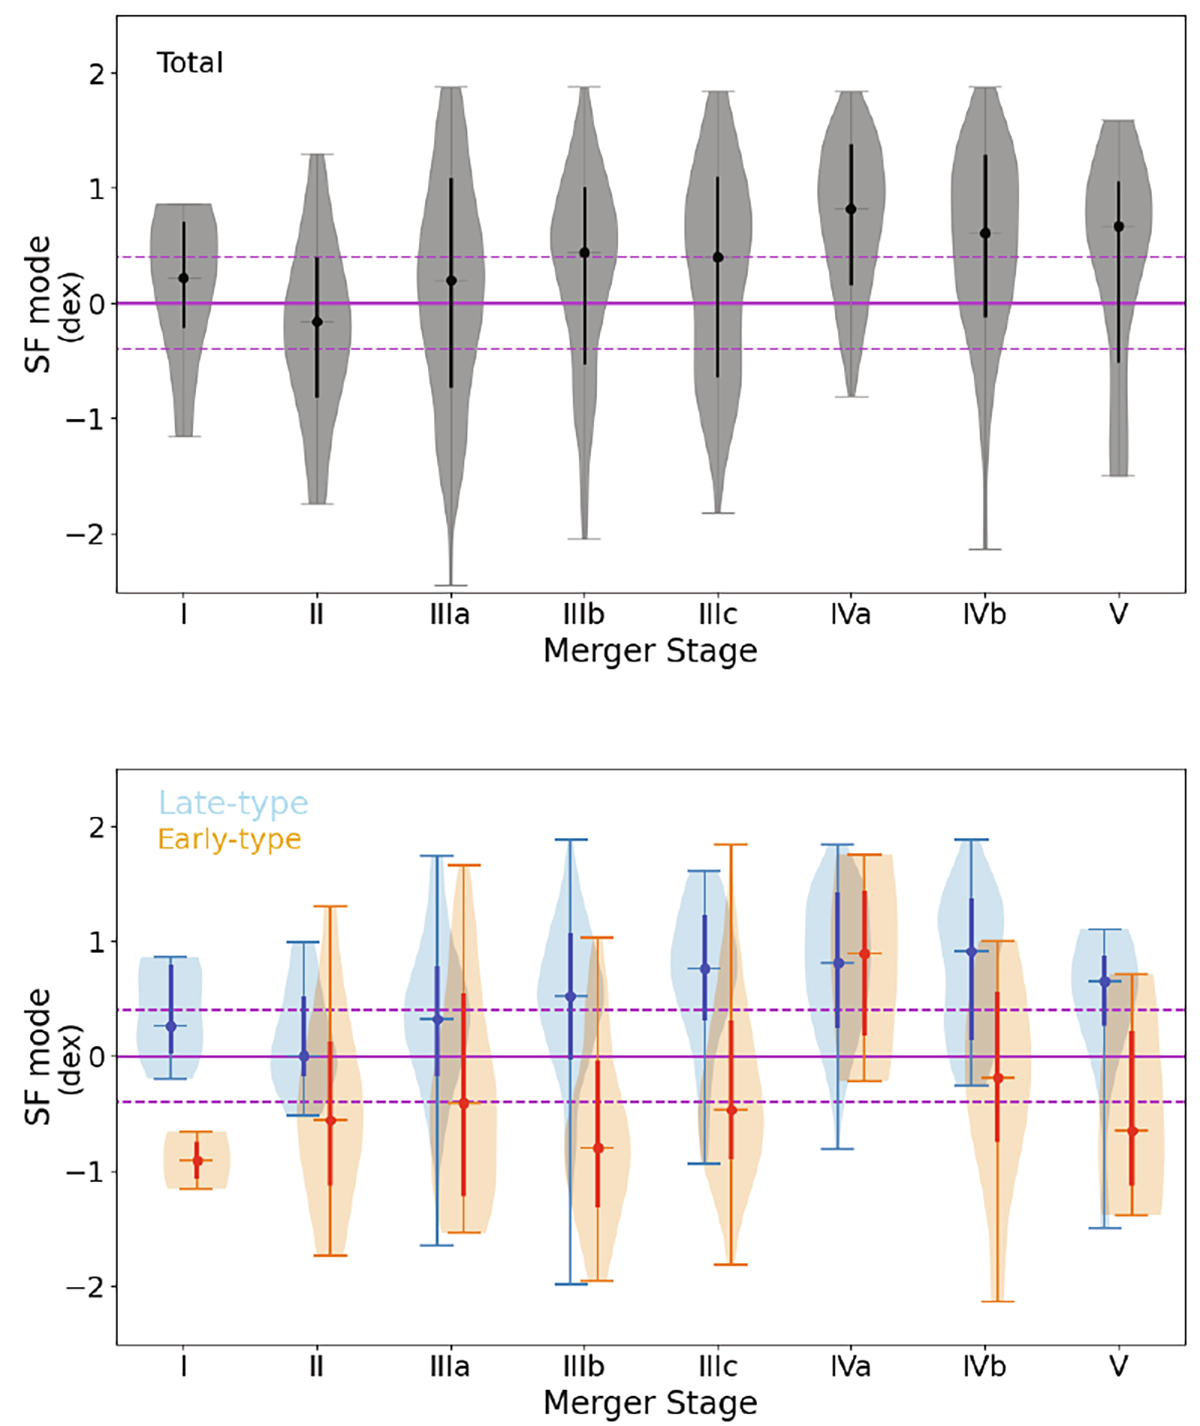
Star formation mode distribution in each merger stage. The filled circles indicate the median, and the bold lines show the percentile including 34% of objects from each side of the median (equivalent to one sigma). The horizontal solid and dashed magenta lines represent the MS. The top panel shows the SF mode distribution of the entire sample. The bottom panel shows the SF mode distribution of the merging galaxies separated by late type (blue) and early type (orange). The HDs are separated into the late- and early-type categories (see text for details).
Current usage metrics show cumulative count of Article Views (full-text article views including HTML views, PDF and ePub downloads, according to the available data) and Abstracts Views on Vision4Press platform.
Data correspond to usage on the plateform after 2015. The current usage metrics is available 48-96 hours after online publication and is updated daily on week days.
Initial download of the metrics may take a while.