Fig. 14
Download original image
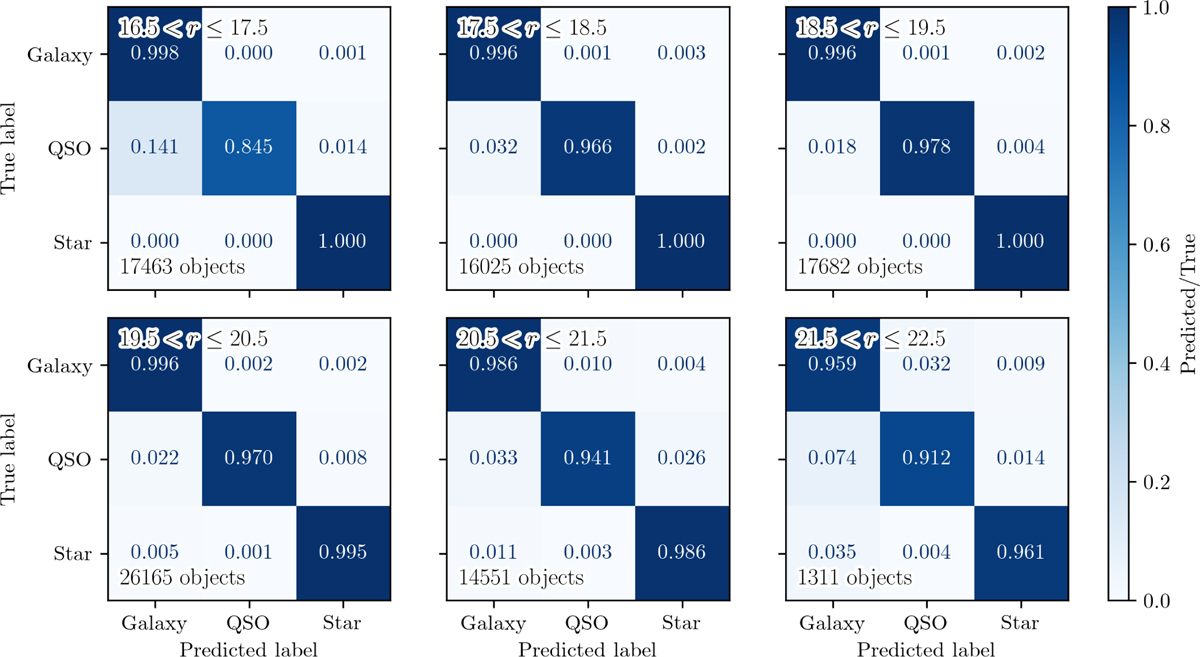
Confusion matrices between the true class and the predicted class for objects in the test sample for different magnitude bins selected with the 2σ criteria. Markers and symbols coincide with those in Fig. 9. The accuracy of the classification is greatly improved when using the predicted uncertainties to select high confidence sources.
Current usage metrics show cumulative count of Article Views (full-text article views including HTML views, PDF and ePub downloads, according to the available data) and Abstracts Views on Vision4Press platform.
Data correspond to usage on the plateform after 2015. The current usage metrics is available 48-96 hours after online publication and is updated daily on week days.
Initial download of the metrics may take a while.