Fig. C.1
Download original image
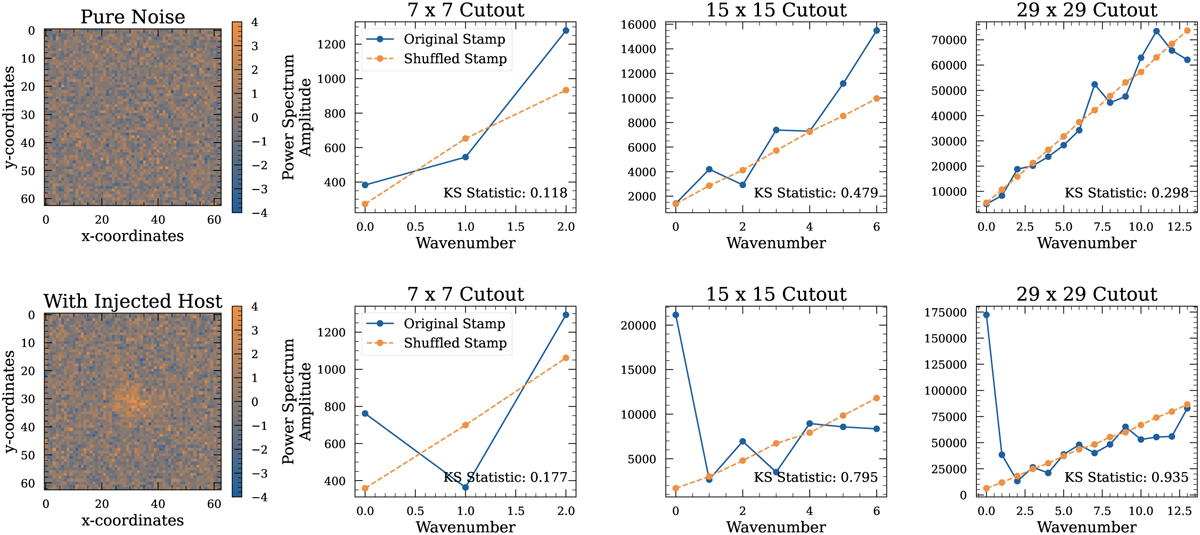
A simulated stamp is shown in the left panel. In the right three panels, the power spectrum for each of the three cut-out sizes are shown. The power spectrum of the original image is plotted with a blue solid line, while the average power spectrum for 200 shuffled versions of the stamp is plotted with an orange dashed line. The KS statistic for each cut-out size is shown in the bottom right hand side of each power spectrum panel. Top: A simulated stamp with pure Gaussian random noise. The stamp has a root mean square (RMS) of 1. The KS statistic for the 15x15 cut-out is less than 0.5, so this stamp would be considered a hostless candidate. Bottom: A simulated stamp with an injected host. The simulated host has a peak amplitude of 2.3 units and is injected into a background of Gaussian random noise with an RMS of 1. Because the KS statistic is greater than 0.5, the host is successfully detected.
Current usage metrics show cumulative count of Article Views (full-text article views including HTML views, PDF and ePub downloads, according to the available data) and Abstracts Views on Vision4Press platform.
Data correspond to usage on the plateform after 2015. The current usage metrics is available 48-96 hours after online publication and is updated daily on week days.
Initial download of the metrics may take a while.