Fig. 11.
Download original image
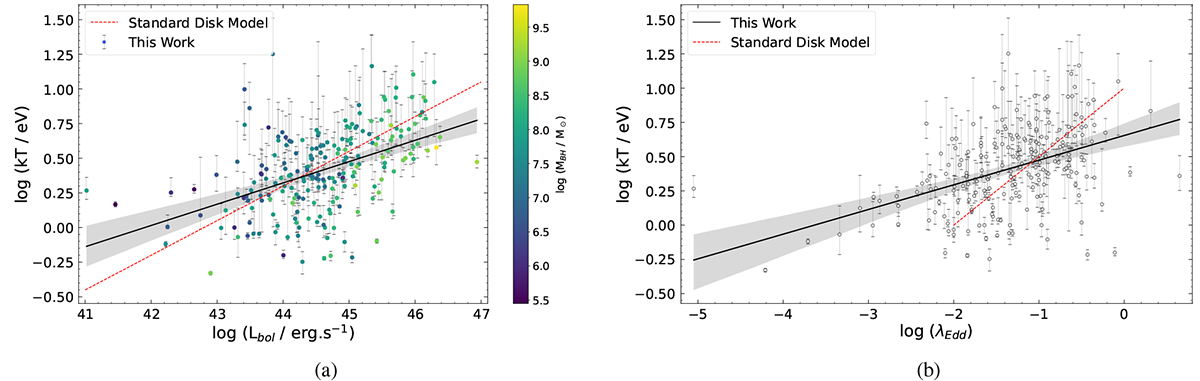
Maximum disk temperature (kTmax) as a function of (a) the bolometric luminosity (color-coded with black hole mass), and (b) the Eddington ratio. The solid black line shows the best-fit relation (Sect. 7.2.1, Table 2) and the shaded gray region is the one sigma confidence interval. The dashed red line is the theoretical relation between (a) kTmax and Lbol (![]() ) and (b) kTmax and λEdd (
) and (b) kTmax and λEdd (![]() ), as is expected from the standard Shakura & Sunyaev (1973) disk model for a fixed black hole mass.
), as is expected from the standard Shakura & Sunyaev (1973) disk model for a fixed black hole mass.
Current usage metrics show cumulative count of Article Views (full-text article views including HTML views, PDF and ePub downloads, according to the available data) and Abstracts Views on Vision4Press platform.
Data correspond to usage on the plateform after 2015. The current usage metrics is available 48-96 hours after online publication and is updated daily on week days.
Initial download of the metrics may take a while.