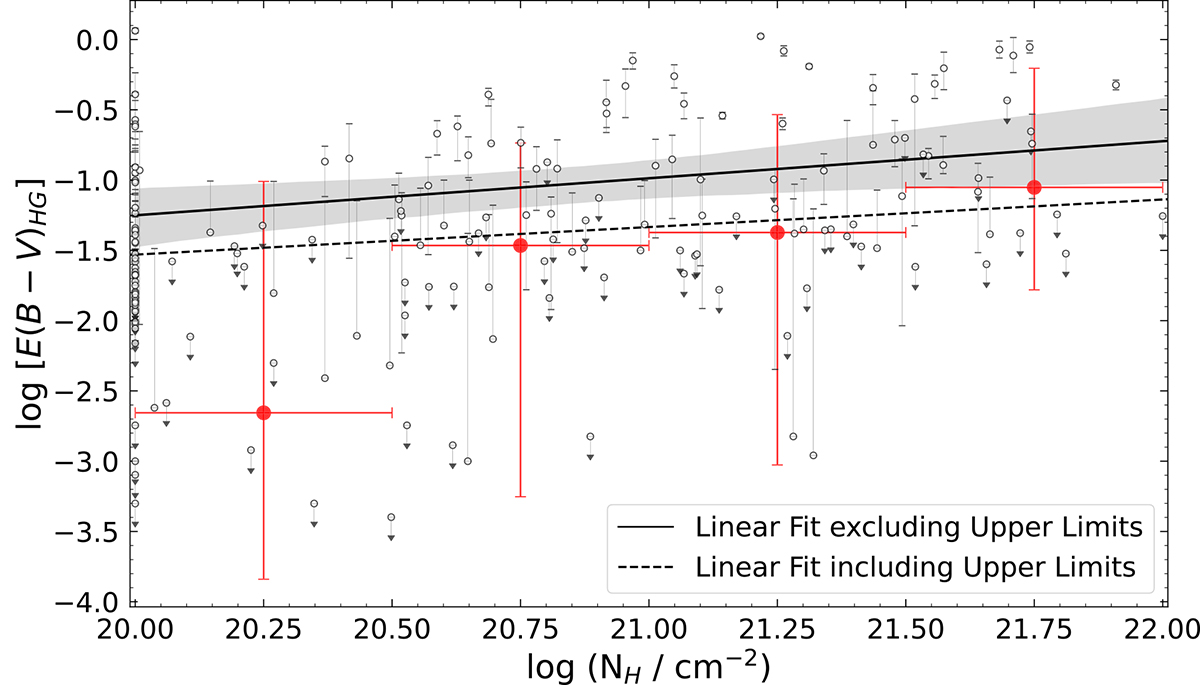
Fig. 13.
Download original image
Host galaxy dust extinction in the optical/UV [E(B − V)HG] as a function of the X-ray column density (NH). Upper limits in E(B − V)HG are shown as downward arrows. The solid black line shows the weak correlation between the two quantities if we exclude the upper limits (Sect. 7.2.2, Table 2) and the shaded gray region represents the uncertainty on the regression relation. The red points are the median E(B − V)HG values (including upper limits) in bins of NH and the dashed black line is the linear fit using survival analysis to include the contribution from all upper limits.
Current usage metrics show cumulative count of Article Views (full-text article views including HTML views, PDF and ePub downloads, according to the available data) and Abstracts Views on Vision4Press platform.
Data correspond to usage on the plateform after 2015. The current usage metrics is available 48-96 hours after online publication and is updated daily on week days.
Initial download of the metrics may take a while.