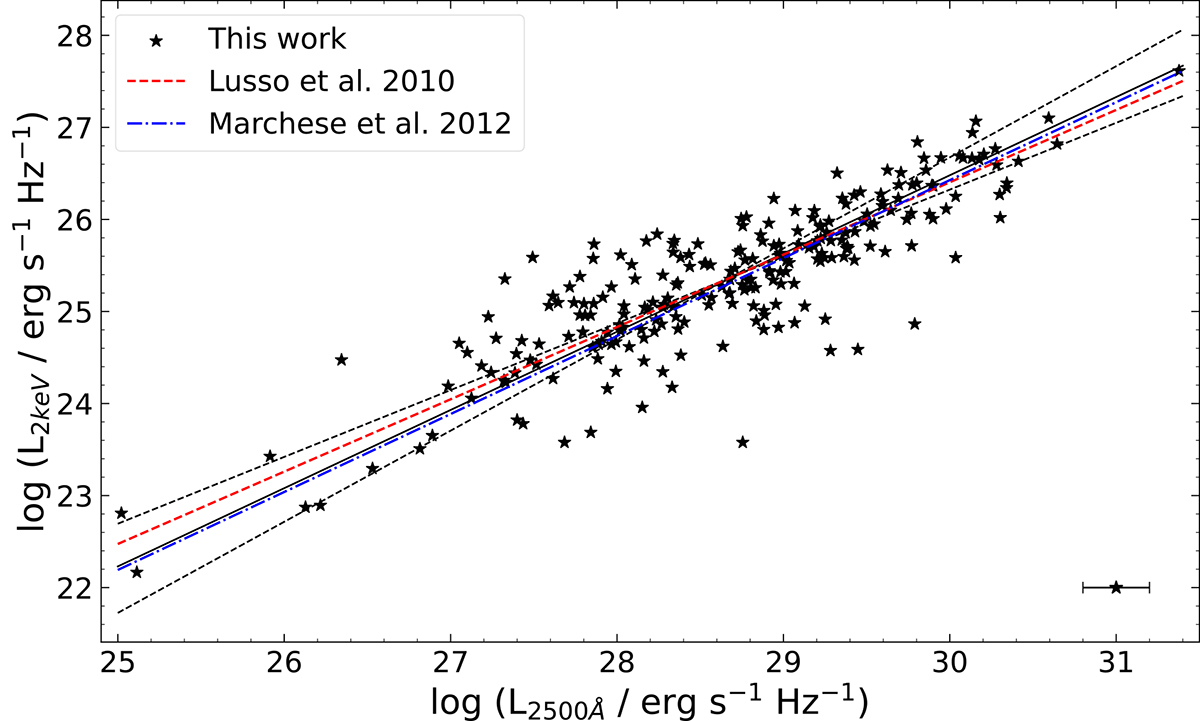
Fig. 14.
Download original image
Monochromatic luminosity at 2500 Åvs. the monochromatic luminosity at 2 keV. The two best-fit relations (Eqs. (4) and (5)) and the final bisector regression from our work (Eq. (6)) are shown as dashed and solid black lines, respectively. We also show the relation reported by Lusso et al. (2010; for their photometrically selected sample) and Marchese et al. (2012) as a dashed red line and a dash-dotted blue line, respectively. The typical uncertainties on L2 keV are less than 5% and those on L2500 Å are shown in the bottom right corner (also valid for subsequent plots including L2 keV and ![]() ).
).
Current usage metrics show cumulative count of Article Views (full-text article views including HTML views, PDF and ePub downloads, according to the available data) and Abstracts Views on Vision4Press platform.
Data correspond to usage on the plateform after 2015. The current usage metrics is available 48-96 hours after online publication and is updated daily on week days.
Initial download of the metrics may take a while.