Fig. 16.
Download original image
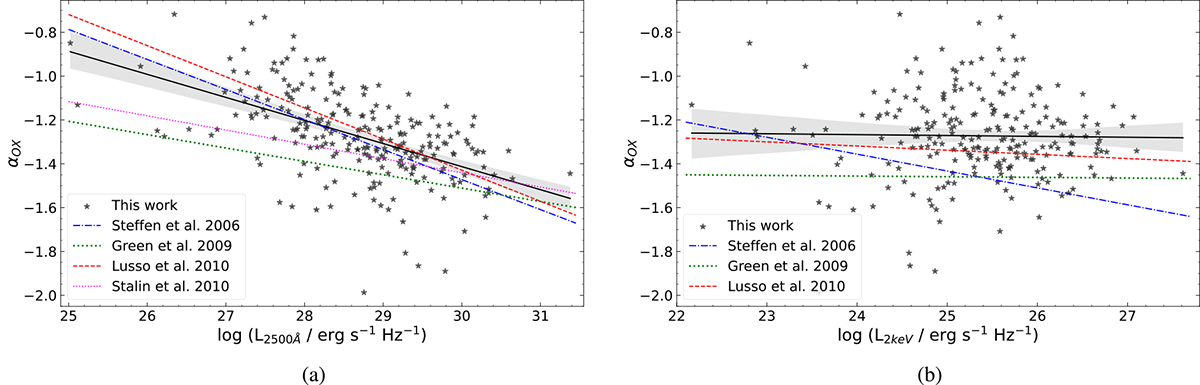
αox as a function of the rest-frame monochromatic luminosity at (a) 2500 Å (UV) and (b) 2 keV (X-ray). We find a tight anticorrelation between αox and L2500 Å (shown as the solid black line in the left panel) but no significant relation with L2 keV (shown as a solid black line in the right panel). For comparison, we also plot the best-fit relations from Steffen et al. (2006; dash-dotted blue line), Green et al. (2009; thick dotted green line), Lusso et al. (2010; dashed red line), and Stalin et al. (2010; dotted magenta line). The shaded gray region shows the one sigma confidence interval for our best-fit linear regression.
Current usage metrics show cumulative count of Article Views (full-text article views including HTML views, PDF and ePub downloads, according to the available data) and Abstracts Views on Vision4Press platform.
Data correspond to usage on the plateform after 2015. The current usage metrics is available 48-96 hours after online publication and is updated daily on week days.
Initial download of the metrics may take a while.