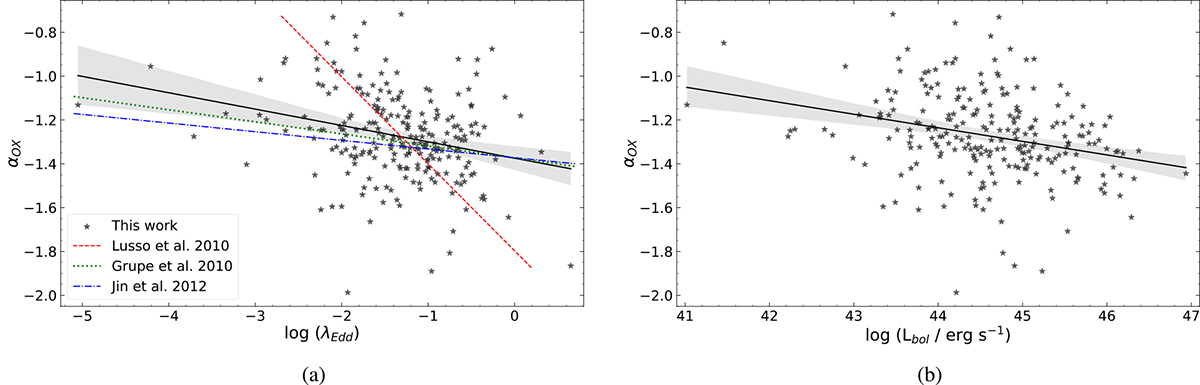
Fig. 17.
Download original image
αox as a function of (a) Eddington ratio and (b) bolometric luminosity. We find a strong anticorrelation of αox with both the parameters (see Table 3). The solid black lines show our best-fit relations and the shaded gray regions are the one sigma confidence interval for each relation. Our linear relation between αox and λEdd is flatter when compared to the one reported by Lusso et al. (2010; dashed red line), but consistent with Grupe et al. (2010; dotted green line) and Jin et al. (2012; dash-dotted blue line).
Current usage metrics show cumulative count of Article Views (full-text article views including HTML views, PDF and ePub downloads, according to the available data) and Abstracts Views on Vision4Press platform.
Data correspond to usage on the plateform after 2015. The current usage metrics is available 48-96 hours after online publication and is updated daily on week days.
Initial download of the metrics may take a while.