Open Access
Fig. 21.
Download original image
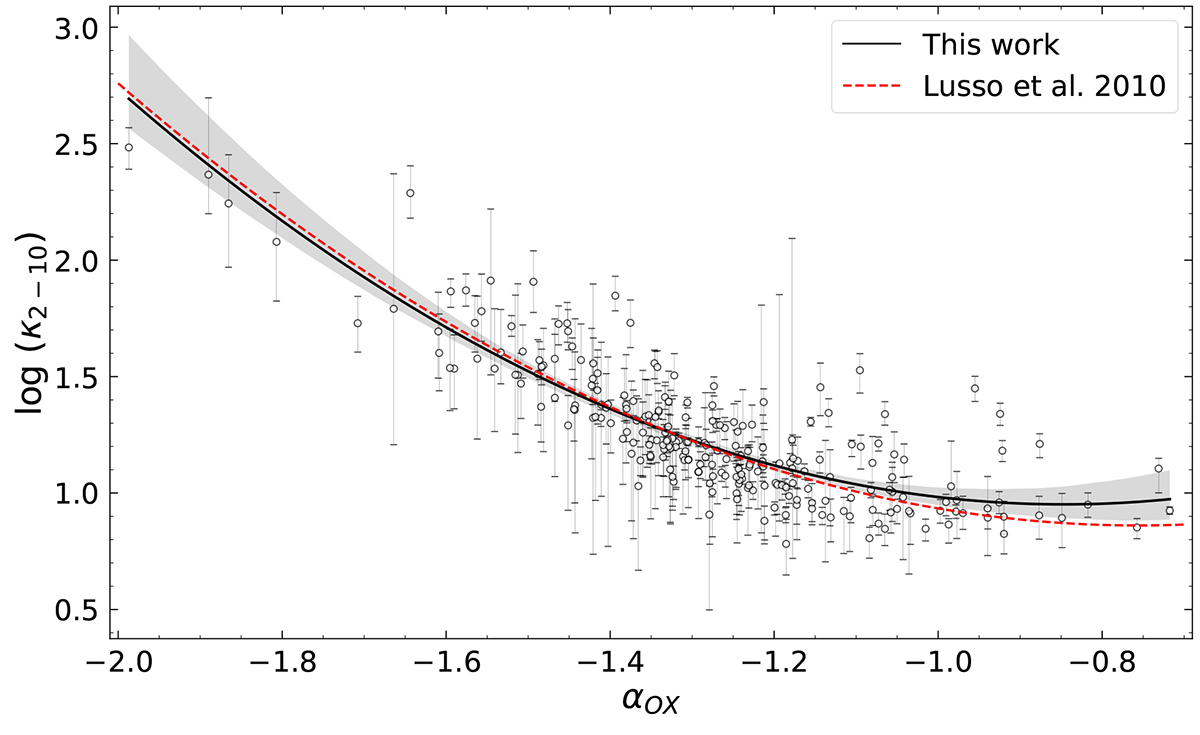
2–10 keV bolometric correction (κ2 − 10) against αox. The solid black line shows the best-fit relation we obtained (Sect. 7.4.1, Table 4), which is in good agreement with the one estimated by Lusso et al. (2010; dashed red line). The shaded gray region shows the one sigma confidence interval for our best-fit relation.
Current usage metrics show cumulative count of Article Views (full-text article views including HTML views, PDF and ePub downloads, according to the available data) and Abstracts Views on Vision4Press platform.
Data correspond to usage on the plateform after 2015. The current usage metrics is available 48-96 hours after online publication and is updated daily on week days.
Initial download of the metrics may take a while.