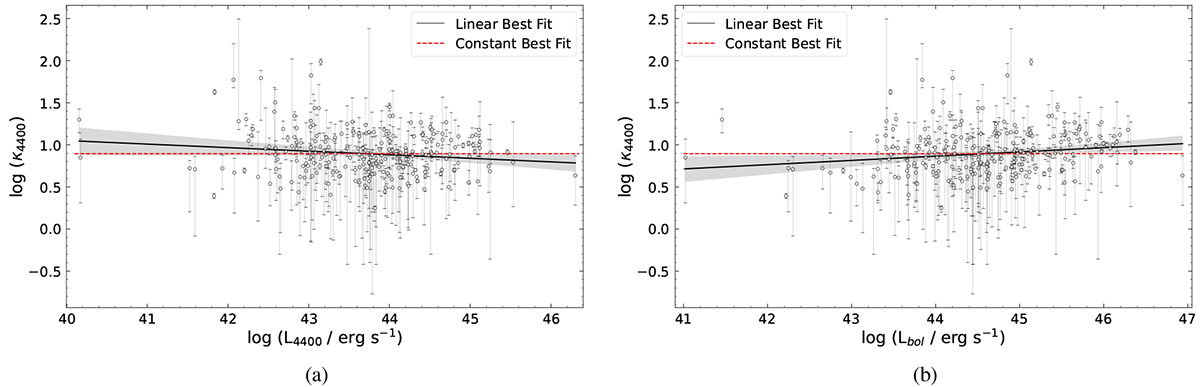
Fig. 22.
Download original image
4400 Å bolometric correction as a function of (a) the 4400 Å monochromatic luminosity and (b) the bolometric luminosity. We find a very weak correlation in both cases (Sect. 7.4.2, Table 4) shown as the black line. Hence, we show the best fit with a constant value as well (dashed red line). For both cases, we get a value of ![]() .
.
Current usage metrics show cumulative count of Article Views (full-text article views including HTML views, PDF and ePub downloads, according to the available data) and Abstracts Views on Vision4Press platform.
Data correspond to usage on the plateform after 2015. The current usage metrics is available 48-96 hours after online publication and is updated daily on week days.
Initial download of the metrics may take a while.