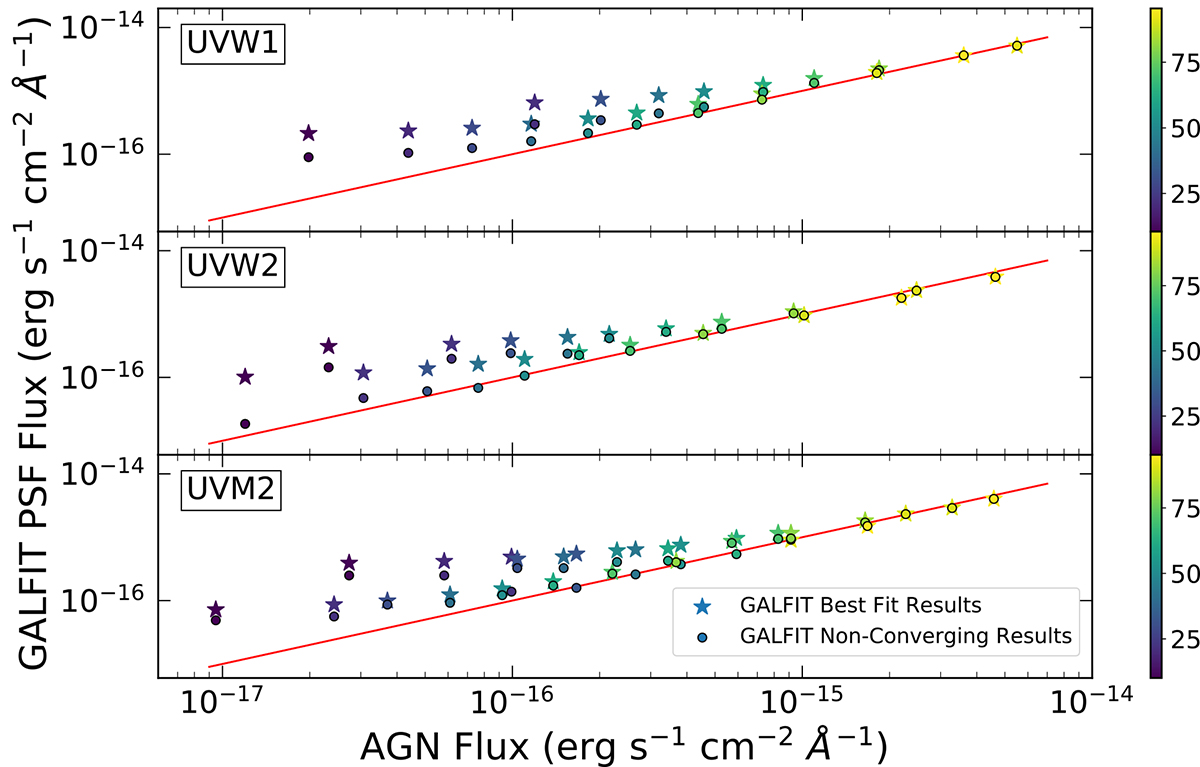
Fig. B.1.
Download original image
Comparing the simulated AGN (star) flux to the PSF flux estimated by GALFIT for the three UV filters. The star symbols show the best-fit results without a Sérsic profile, while the circle symbols show the results when the fitting with a Sérsic profile does not converge but we still get better constraints on the PSF profile compared to the fit without a Sérsic profile. The x = y line is shown in red. The color bar indicates the AGN light ratio in percent.
Current usage metrics show cumulative count of Article Views (full-text article views including HTML views, PDF and ePub downloads, according to the available data) and Abstracts Views on Vision4Press platform.
Data correspond to usage on the plateform after 2015. The current usage metrics is available 48-96 hours after online publication and is updated daily on week days.
Initial download of the metrics may take a while.