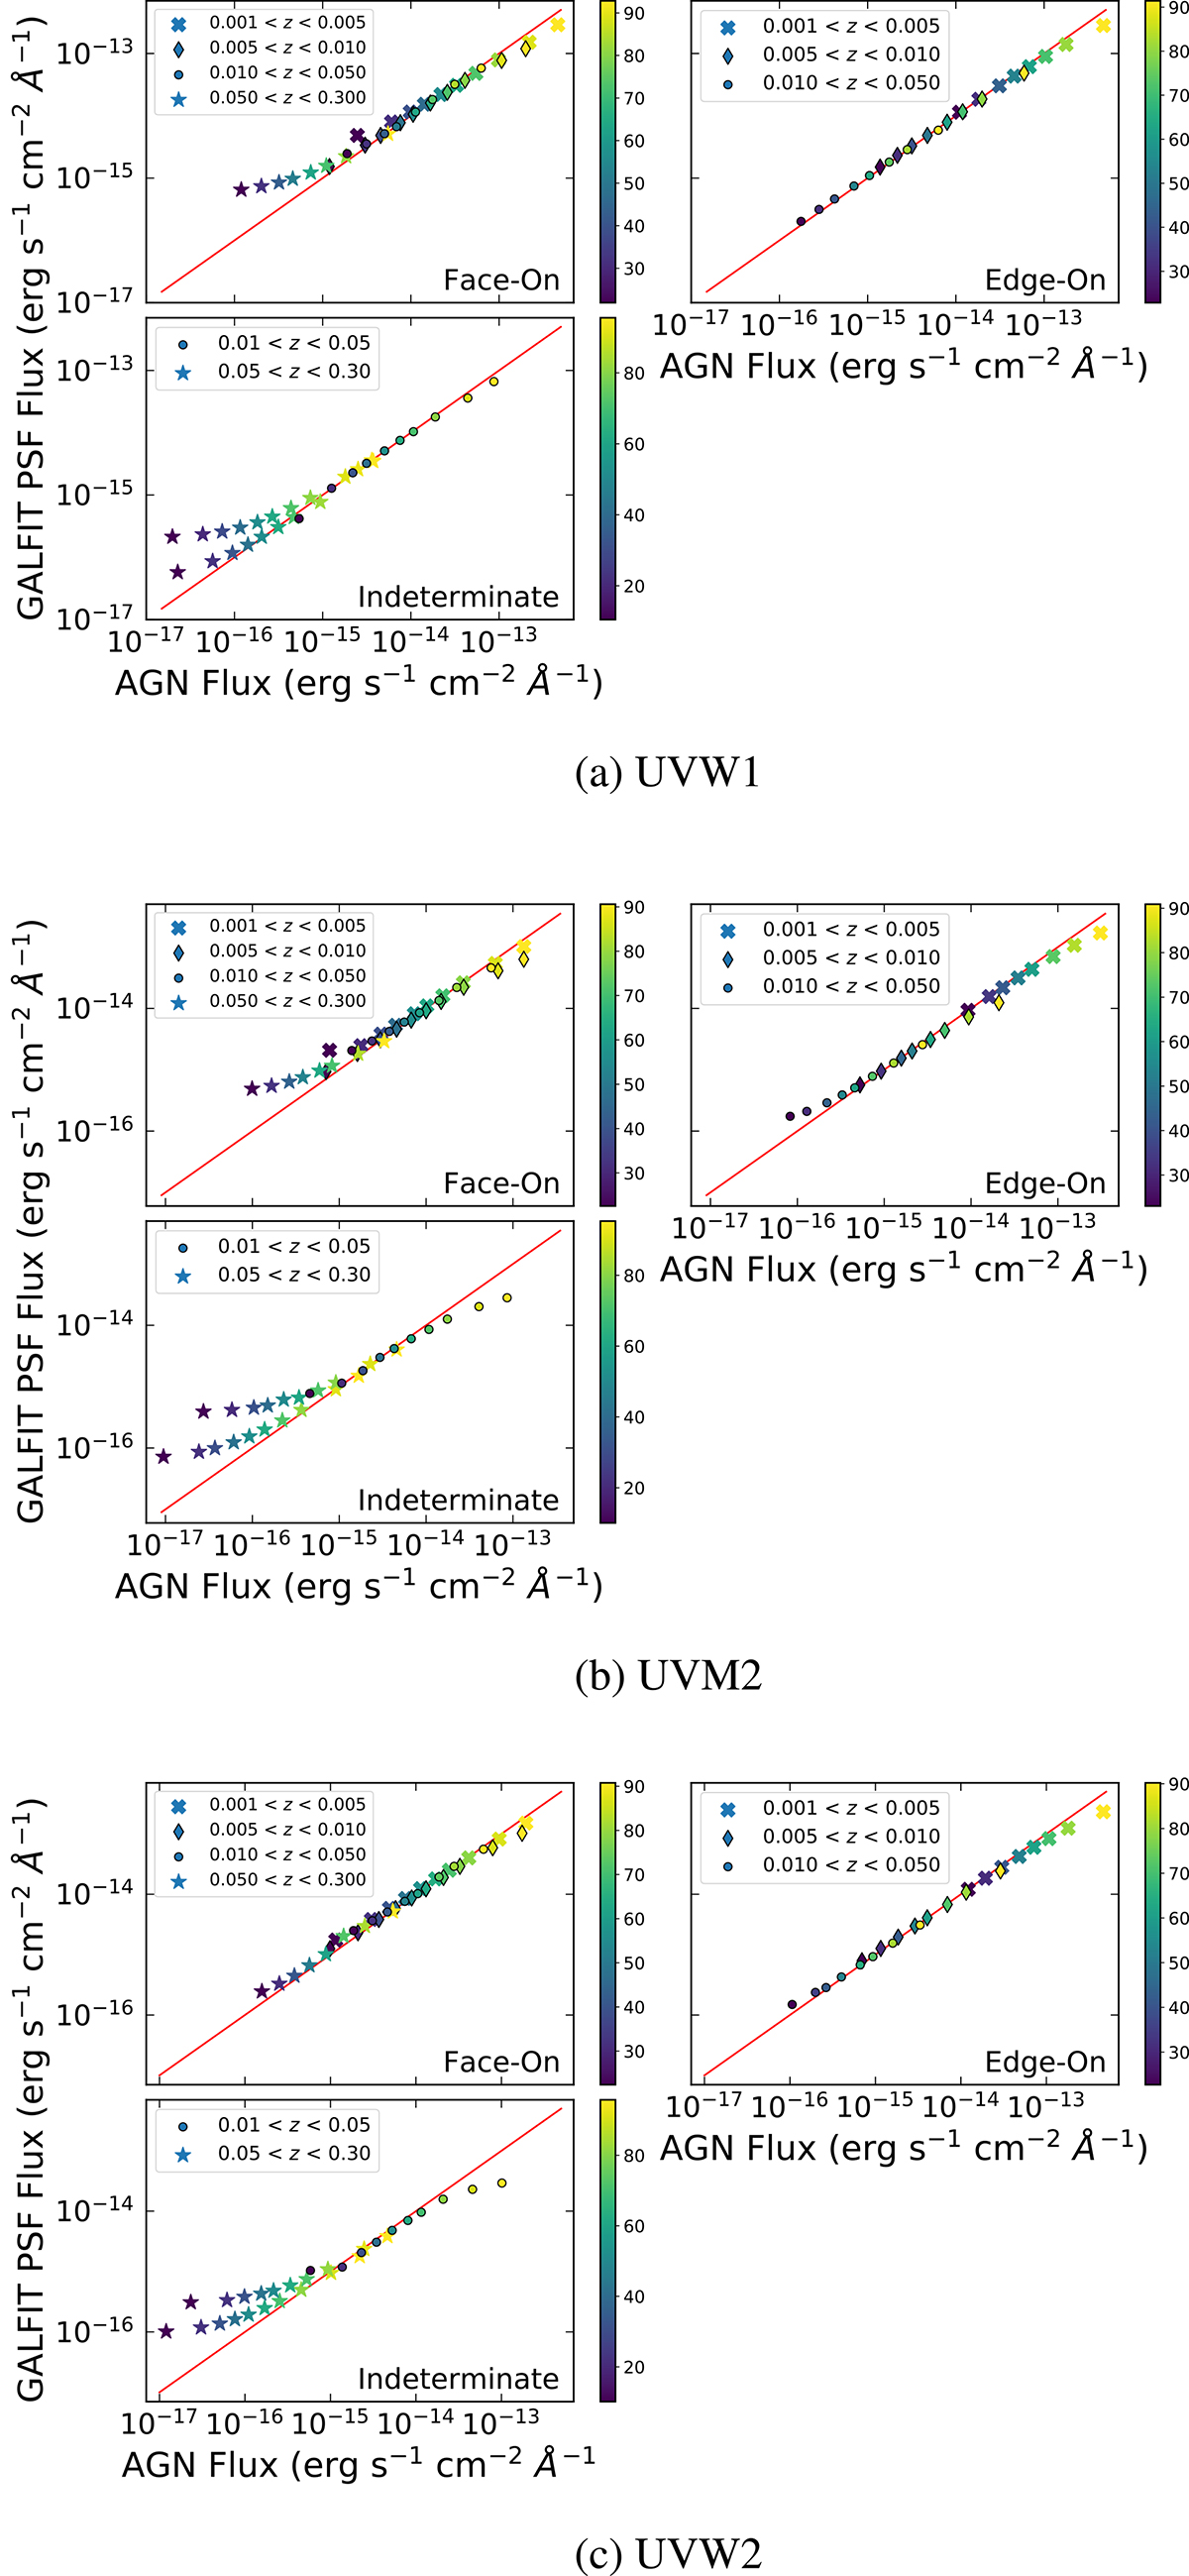
Fig. B.5.
Download original image
Comparison of the simulated AGN (star) flux to the PSF flux estimated by GALFIT for filters (a) UVW1, (b)UVM2, and (c) UVW2. The three subplots in each figure show the three different morphologies considered and the different symbols correspond to the redshift range. The x = y line is shown in red. The color bar indicates the AGN light ratio in percent.
Current usage metrics show cumulative count of Article Views (full-text article views including HTML views, PDF and ePub downloads, according to the available data) and Abstracts Views on Vision4Press platform.
Data correspond to usage on the plateform after 2015. The current usage metrics is available 48-96 hours after online publication and is updated daily on week days.
Initial download of the metrics may take a while.