Fig. 4.
Download original image
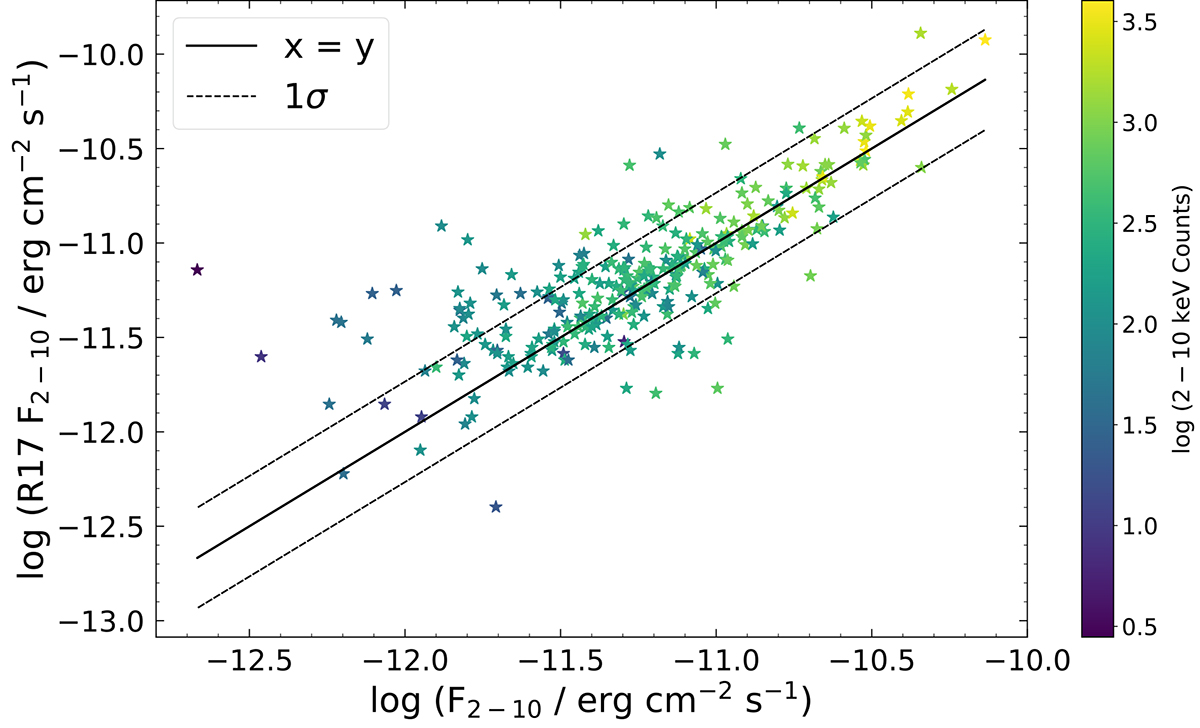
Comparison between the 2–10 keV intrinsic flux we obtained and that obtained by R17 following a detailed broadband X-ray spectral analysis. The points are color-coded with the counts in the 2–10 keV energy range showing that the maximum offset with 1:1 line is observed in sources with least counts. The x = y line is shown in black and the 1σ dispersion line is shown as a dashed black line. The typical uncertainties on F2 − 10 calculated from our work are less than 5%.
Current usage metrics show cumulative count of Article Views (full-text article views including HTML views, PDF and ePub downloads, according to the available data) and Abstracts Views on Vision4Press platform.
Data correspond to usage on the plateform after 2015. The current usage metrics is available 48-96 hours after online publication and is updated daily on week days.
Initial download of the metrics may take a while.