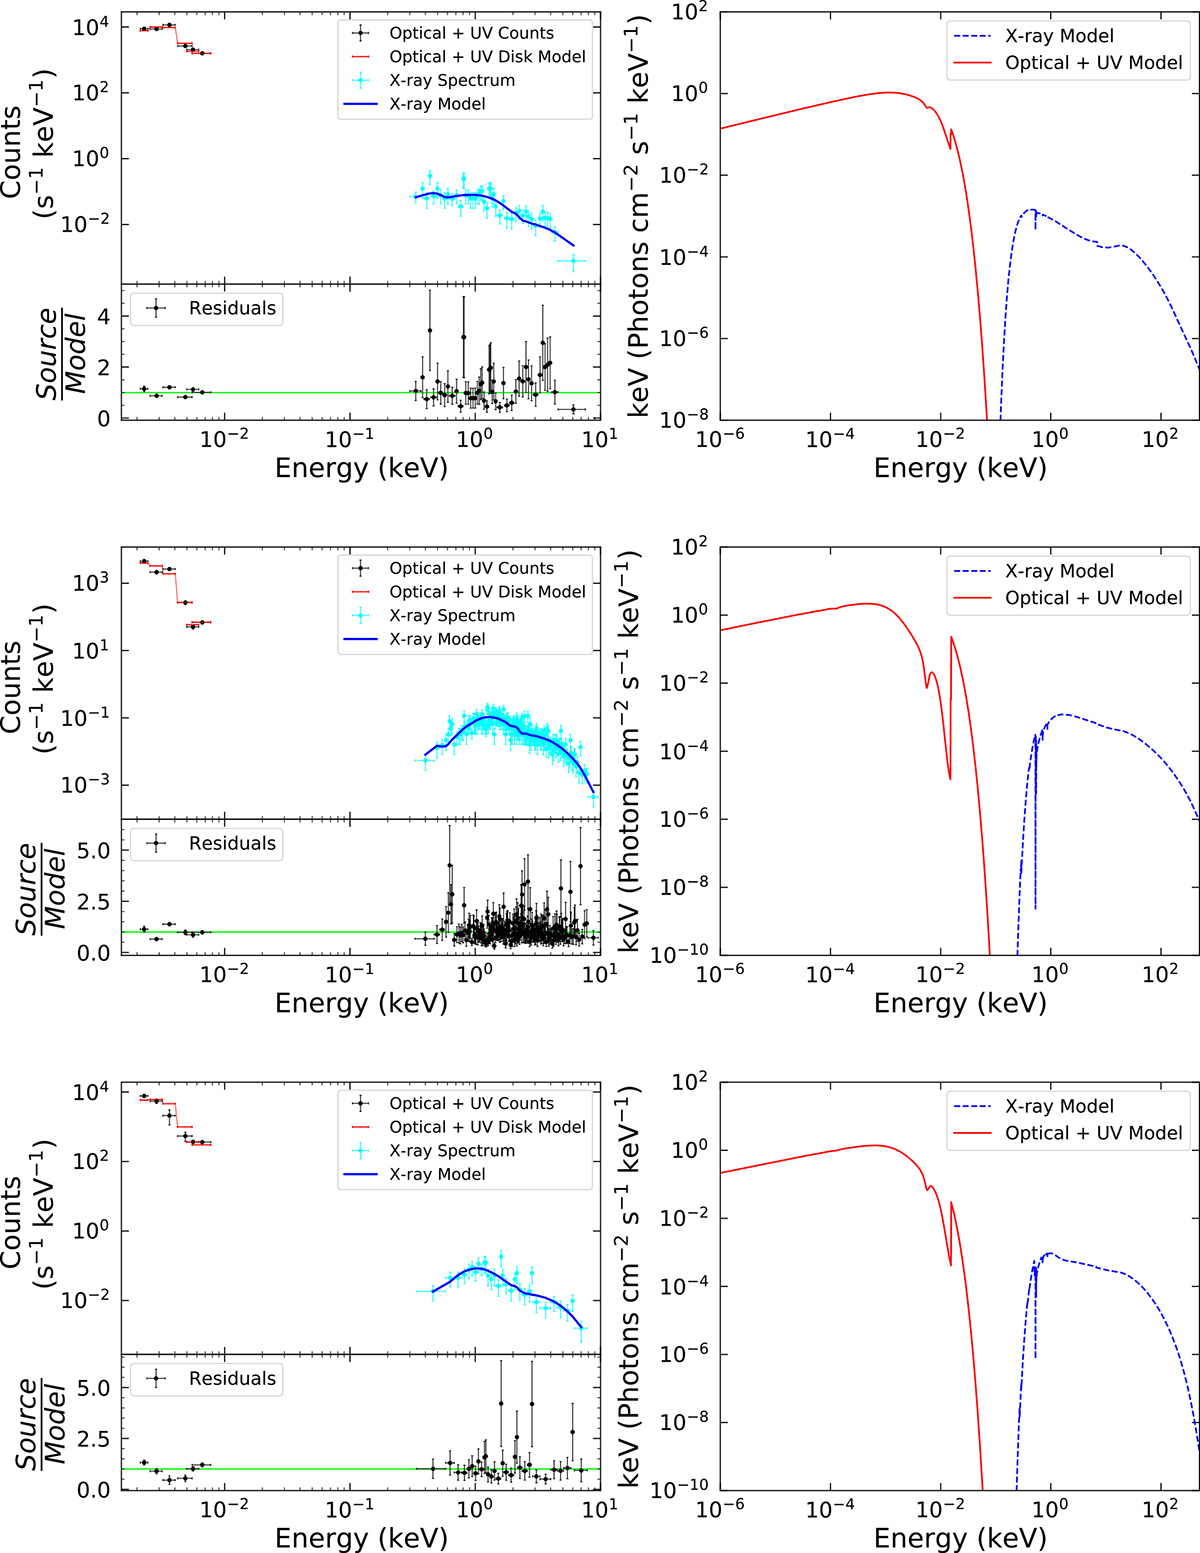
Fig. 8.
Download original image
Examples of the optical-to-X-ray SED fits. From top to bottom, the fits are for SWIFTJ0002.5+0323, SWIFTJ0654.6+0700, and SWIFTJ1316.9-7155. The left panel shows the counts in the optical/UV filters (black points) and the 0.3–10 keV X-ray spectrum (cyan points). The figure also shows the fit obtained using the optical/UV disk model including dust extinction (in red) and the X-ray model (in blue), along with the fit residuals (bottom left panel). The right panel shows the best-fit SED model for each source.
Current usage metrics show cumulative count of Article Views (full-text article views including HTML views, PDF and ePub downloads, according to the available data) and Abstracts Views on Vision4Press platform.
Data correspond to usage on the plateform after 2015. The current usage metrics is available 48-96 hours after online publication and is updated daily on week days.
Initial download of the metrics may take a while.