Fig. 2
Download original image
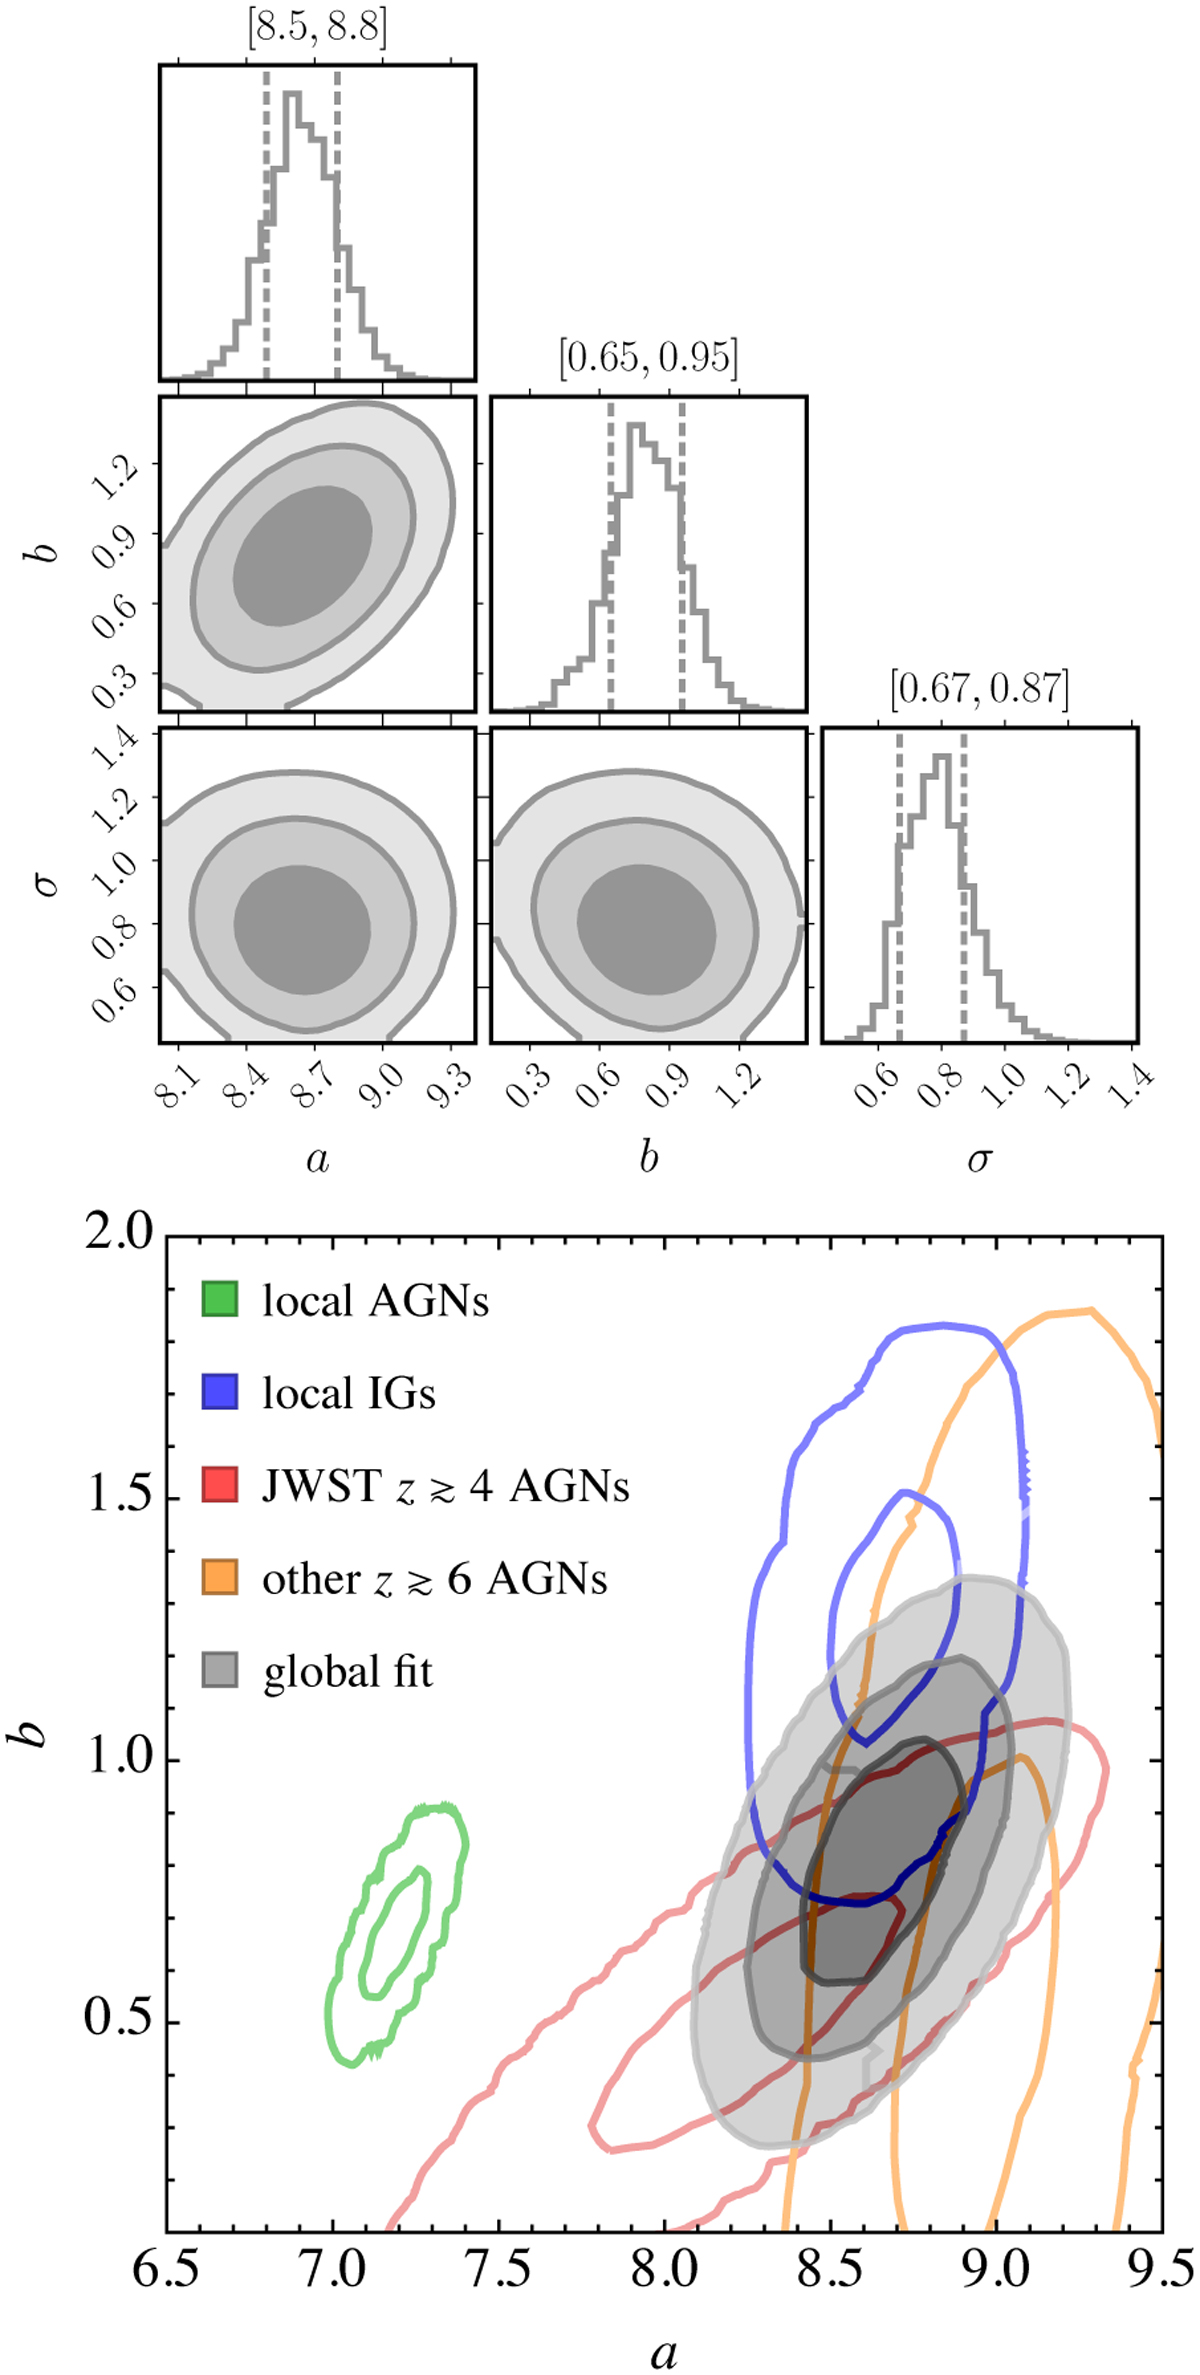
Upper panel: corner plot showing the posteriors for the global fit to JWST (Übler et al. 2023; Larson et al. 2023; Harikane et al. 2023; Bogdan et al. 2024; Ding et al. 2023; Maiolino et al. 2024a; Yue et al. 2023) and previous high-z SMBH data from I21 as well as low-z RV15 data on SMBHs in IGs. Lower panel: 68, 95, and 99.8% CL contours (grey) of the posteriors for a and b defined in Eq. (1), obtained in a global fit that includes all observations except local AGNs by marginalising over σ. For comparison, the 68 and 99.8% CL of individual datasets are shown: JWST high-z measurements (red; Übler et al. 2023; Larson et al. 2023; Harikane et al. 2023; Bogdan et al. 2024; Ding et al. 2023; Maiolino et al. 2024a; Yue et al. 2023), other high-z measurements from I21 (yellow), local IGs (blue), and local AGNs from RV15 (green). The fits were performed using flat priors and including the uncertainties in the observations. Corner plots showing the posterior distributions for these fits are displayed in the appendix.
Current usage metrics show cumulative count of Article Views (full-text article views including HTML views, PDF and ePub downloads, according to the available data) and Abstracts Views on Vision4Press platform.
Data correspond to usage on the plateform after 2015. The current usage metrics is available 48-96 hours after online publication and is updated daily on week days.
Initial download of the metrics may take a while.