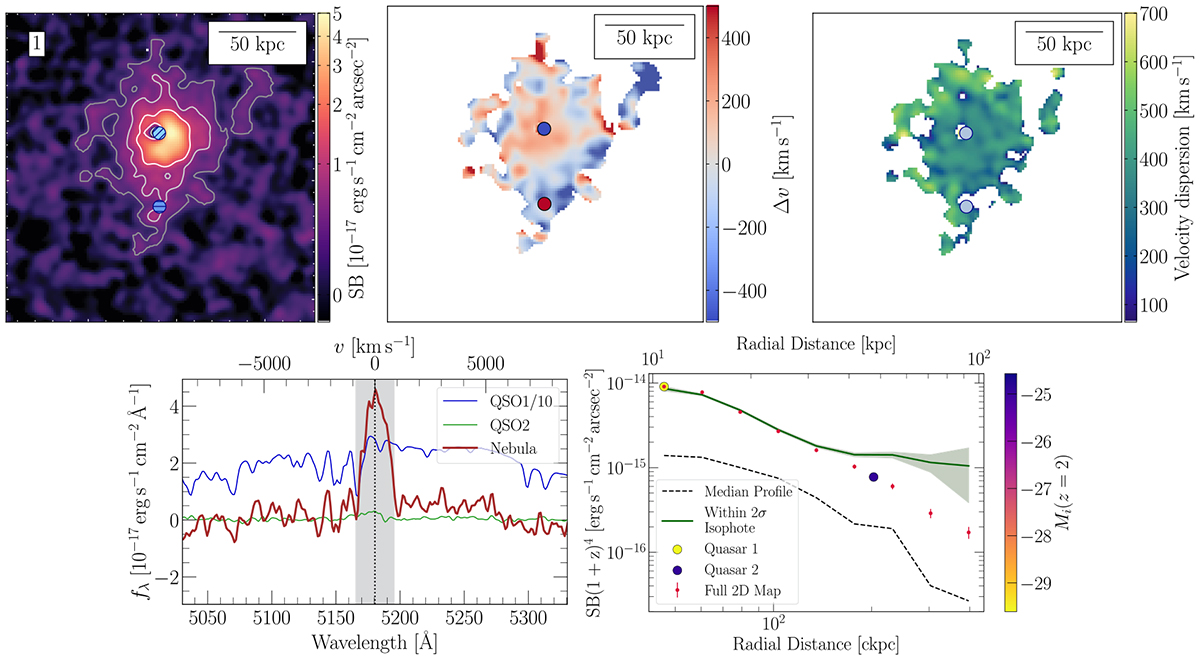
Fig. 3.
Download original image
Lyα maps and profiles for quasar pair 1 (ID 1.1 and ID 1.2). All maps have been smoothed by a 2D Gaussian kernel with a standard deviation of 2 pixels or 0.4″ and were obtained from the PSF-subtracted optimized PNBs. Shown is a 26″ × 26″ (or about 200 × 200 kpc) cut-out centered between quasar 1.1 and quasar 1.2. Top left: Lyα surface brightness map. The position of the brighter quasar is indicated with a light blue, diagonally dashed circle with a diameter of 1 arcsec, the dimmer quasar is indicated by the darker blue, horizontally dashed circle with the same diameter. Contour lines indicate a detection of 2σ (dark gray), 4σ (light gray) and 10σ (white). The surface brightness maps of all pairs are shown with the same colorbar range to ease comparison. Top middle: Velocity offset with respect to the PNB center of the Lyα line within the 2σ isophote, calculated within the PNB wavelength range. Quasar positions are marked with circles color-coded by their systemic redshift on the same colorbar scale as the map. Top right: Velocity dispersion of the Lyα line within the 2σ isophote. Bottom left: Spectrum of the brighter (QSO1) and dimmer (QSO2) quasar integrated within an aperture of 3″ and spectrum of the nebula integrated within the 2σ isophote indicated in the surface brightness map. The spectra are centered on the Lyα peak of the nebula chosen as the PNB center (black dashed line). The slices used for the PNB are marked in gray. All spectra are smoothed with a Gaussian kernel with a standard deviation of 1 pixel or 1.25 Å. The spectrum of quasar 1.1 is scaled down by a factor of 10. Bottom right: Cosmologically corrected surface brightness profiles calculated in logarithmically spaced annuli around the brighter quasar. Quasar positions are indicated by the dots, color coded by Mi(z = 2). The profile represented by red dots is calculated in the full PNB after masking continuum sources and subtracting the background, the errorbars in y-direction show the 1σ error. For comparison, the median stacked profile of all pairs is plotted as black dashed line. The green curve is calculated within the 2σ isophote indicated in the surface brightness map, with shaded regions showing the 1σ error calculated in the same annuli in the variance cube.
Current usage metrics show cumulative count of Article Views (full-text article views including HTML views, PDF and ePub downloads, according to the available data) and Abstracts Views on Vision4Press platform.
Data correspond to usage on the plateform after 2015. The current usage metrics is available 48-96 hours after online publication and is updated daily on week days.
Initial download of the metrics may take a while.