Fig. 5.
Download original image
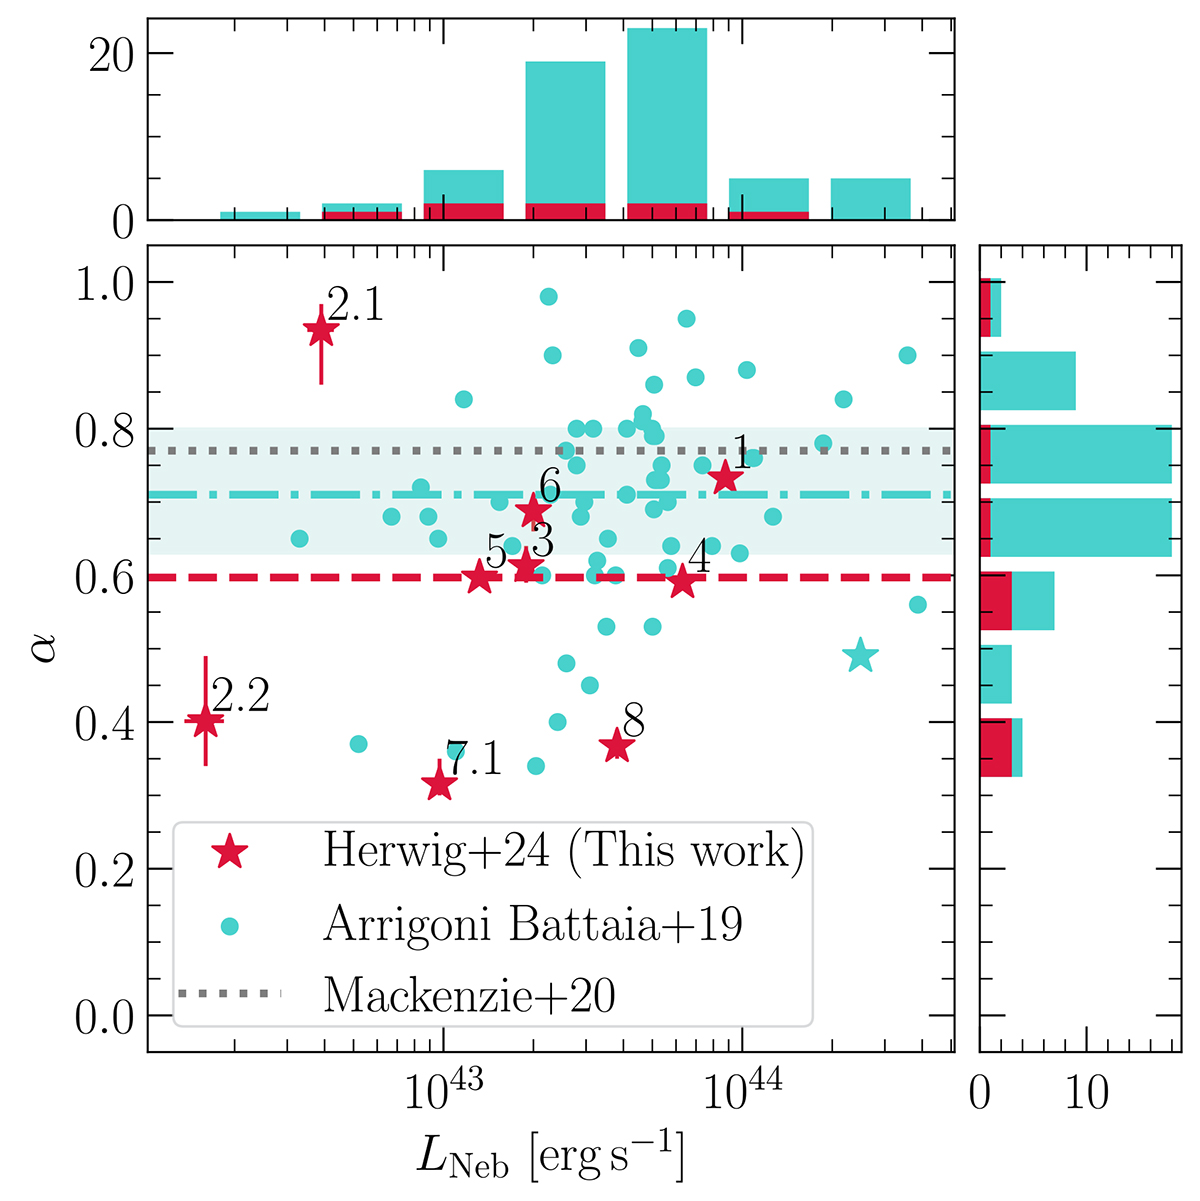
Lyα nebulae axis ratio versus their luminosity. The values for the nebulae discovered around the studied quasar pairs (red stars, accompanied by the quasar ID) are compared with those for nebulae found around bright (cyan dots and cyan dash-dotted line; Arrigoni Battaia et al. 2019a) and faint (dotted gray line; Mackenzie et al. 2021) z ∼ 3 quasars. The cyan star indicates the value for the Fabulous ELAN in Arrigoni Battaia et al. (2019a), which is hosted by an AGN triplet (of which two are type-I quasars as in this work). The cyan shaded region indicates the 25th and 75th percentiles of the distribution of bright quasars.
Current usage metrics show cumulative count of Article Views (full-text article views including HTML views, PDF and ePub downloads, according to the available data) and Abstracts Views on Vision4Press platform.
Data correspond to usage on the plateform after 2015. The current usage metrics is available 48-96 hours after online publication and is updated daily on week days.
Initial download of the metrics may take a while.