Fig. 5.
Download original image
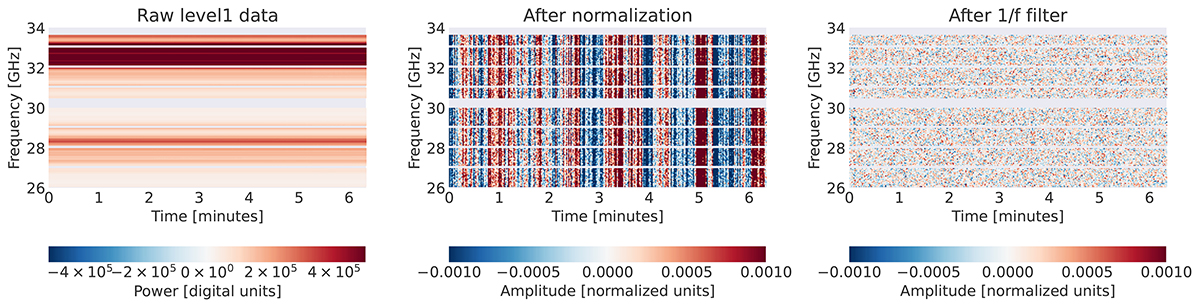
Illustration of the effect of TOD normalization and 1/f filtering for a single feed and scan. The raw Level 1 data (left) are dominated by frequency-dependent gain variations, that correspond to the instrumental bandpass. After normalization (middle), the signal is dominated by common-mode gain fluctuations. Finally, after the 1/f filter is applied (right), the common-mode 1/f contribution has been suppressed, and the data are dominated by white noise. The horizontal gray stripes indicate channels that were masked by the pipeline. All three stages happen before absolute calibration, and the amplitudes are therefore given in arbitrary units.
Current usage metrics show cumulative count of Article Views (full-text article views including HTML views, PDF and ePub downloads, according to the available data) and Abstracts Views on Vision4Press platform.
Data correspond to usage on the plateform after 2015. The current usage metrics is available 48-96 hours after online publication and is updated daily on week days.
Initial download of the metrics may take a while.