Fig. 1.
Download original image
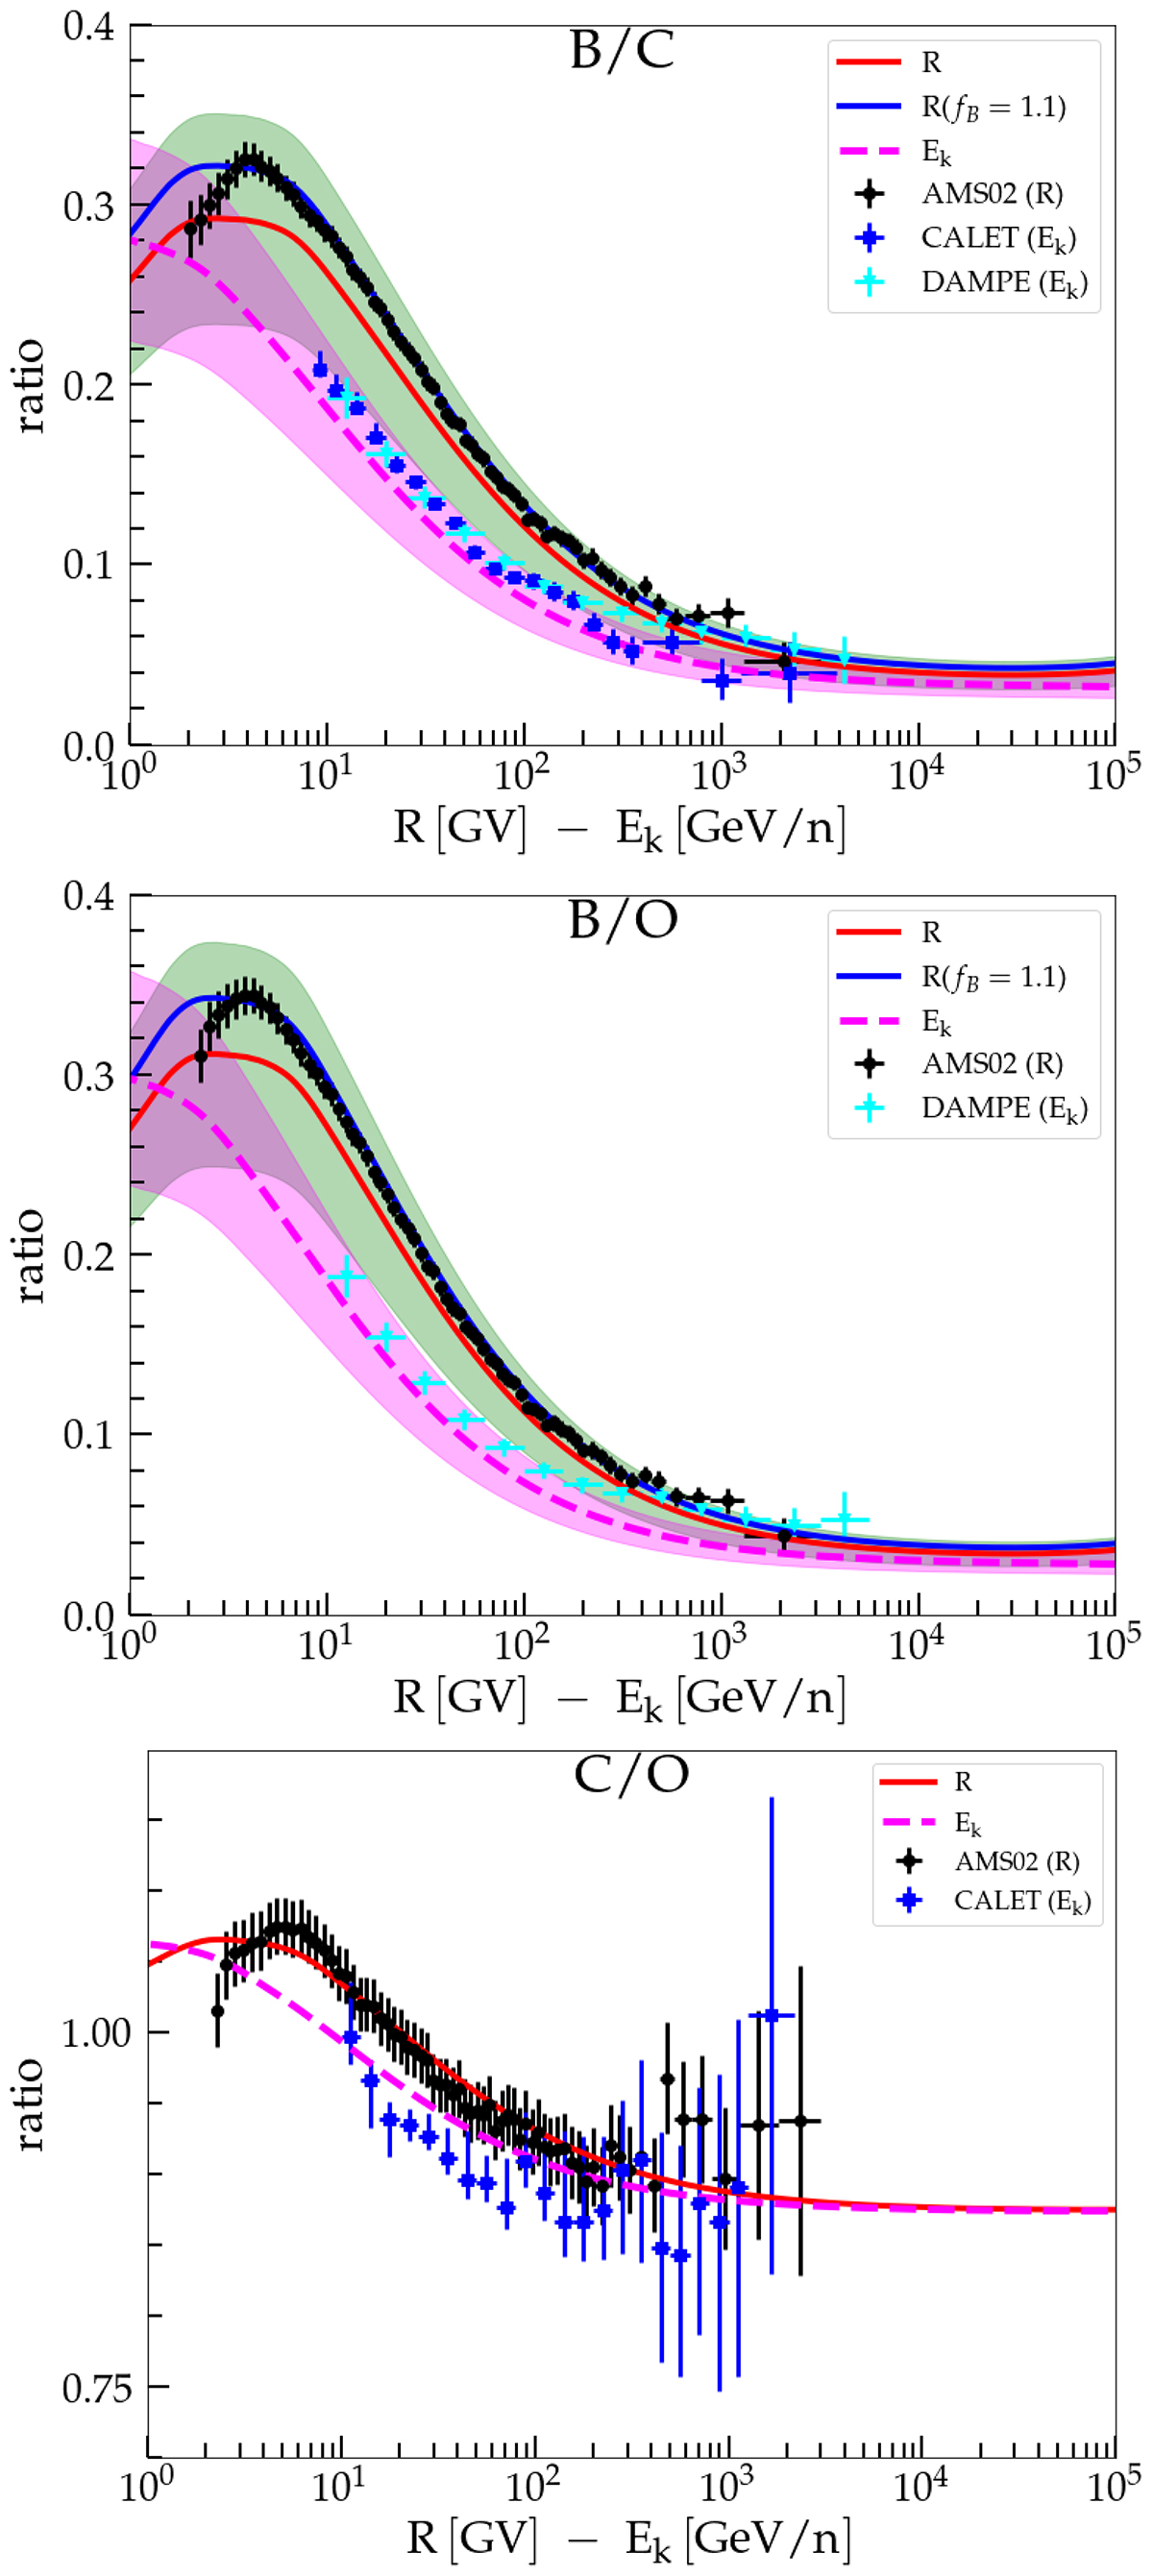
B/C (top panel), B/O (middle panel), and C/O (bottom panel) ratios compared to the data of AMS02 (Aguilar et al. 2021d, black dots), CALET (Adriani et al. 2020, blue squares), and DAMPE (Dampe Collaboration 2022, cyan triangles). The solid red (dashed magenta) line corresponds to the ratio as a function of rigidity (kinetic energy per nucleon) and is compared to the AMS02 (CALET and DAMPE) data. The green (pink) shaded region corresponds to a 20% uncertainty in the secondary production cross section. The solid blue line corresponds to the B/C or B/O ratio when the B flux is multiplied by fB = 1.1, as in Fig. 7.
Current usage metrics show cumulative count of Article Views (full-text article views including HTML views, PDF and ePub downloads, according to the available data) and Abstracts Views on Vision4Press platform.
Data correspond to usage on the plateform after 2015. The current usage metrics is available 48-96 hours after online publication and is updated daily on week days.
Initial download of the metrics may take a while.