Fig. 10.
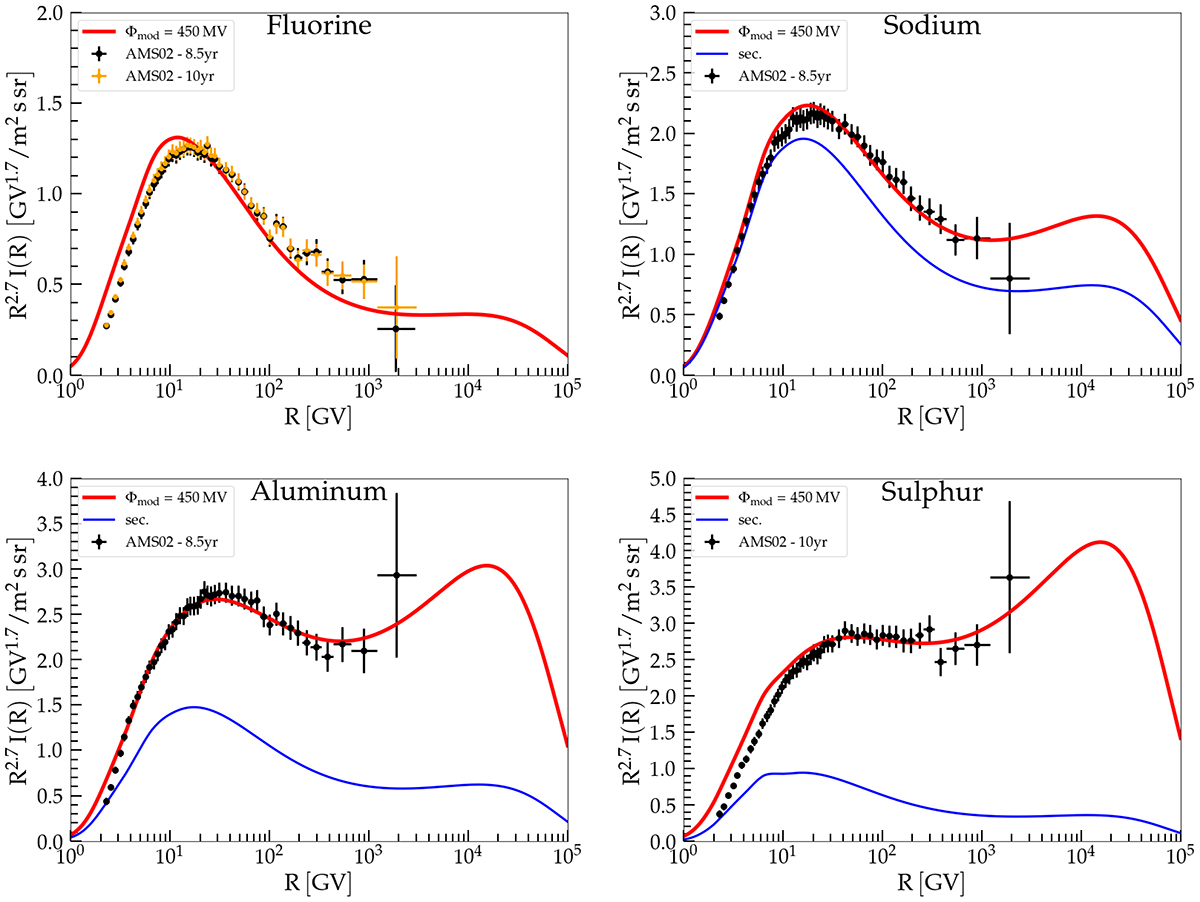
Download original image
F, Na, Al, and S modulated fluxes. Top left panel: F modulated flux (red solid line) compared to the data of AMS02 (Aguilar et al. 2021b, 2023, blackdots, yellowdiamonds). Top right panel: Na modulated flux (red solid line) and its secondary component (blue solid line) compared to the data of AMS02 (Aguilar et al. 2021c) Bottom left panel: Al modulated flux (red solid line) and its secondary component (blue solid line) compared to the data of AMS02 (Aguilar et al. 2021c) Bottom right panel: S modulated flux (red solid line) and its secondary component (blue solid line) compared to the data of AMS02 (Aguilar et al. 2023).
Current usage metrics show cumulative count of Article Views (full-text article views including HTML views, PDF and ePub downloads, according to the available data) and Abstracts Views on Vision4Press platform.
Data correspond to usage on the plateform after 2015. The current usage metrics is available 48-96 hours after online publication and is updated daily on week days.
Initial download of the metrics may take a while.