Fig. 2.
Download original image
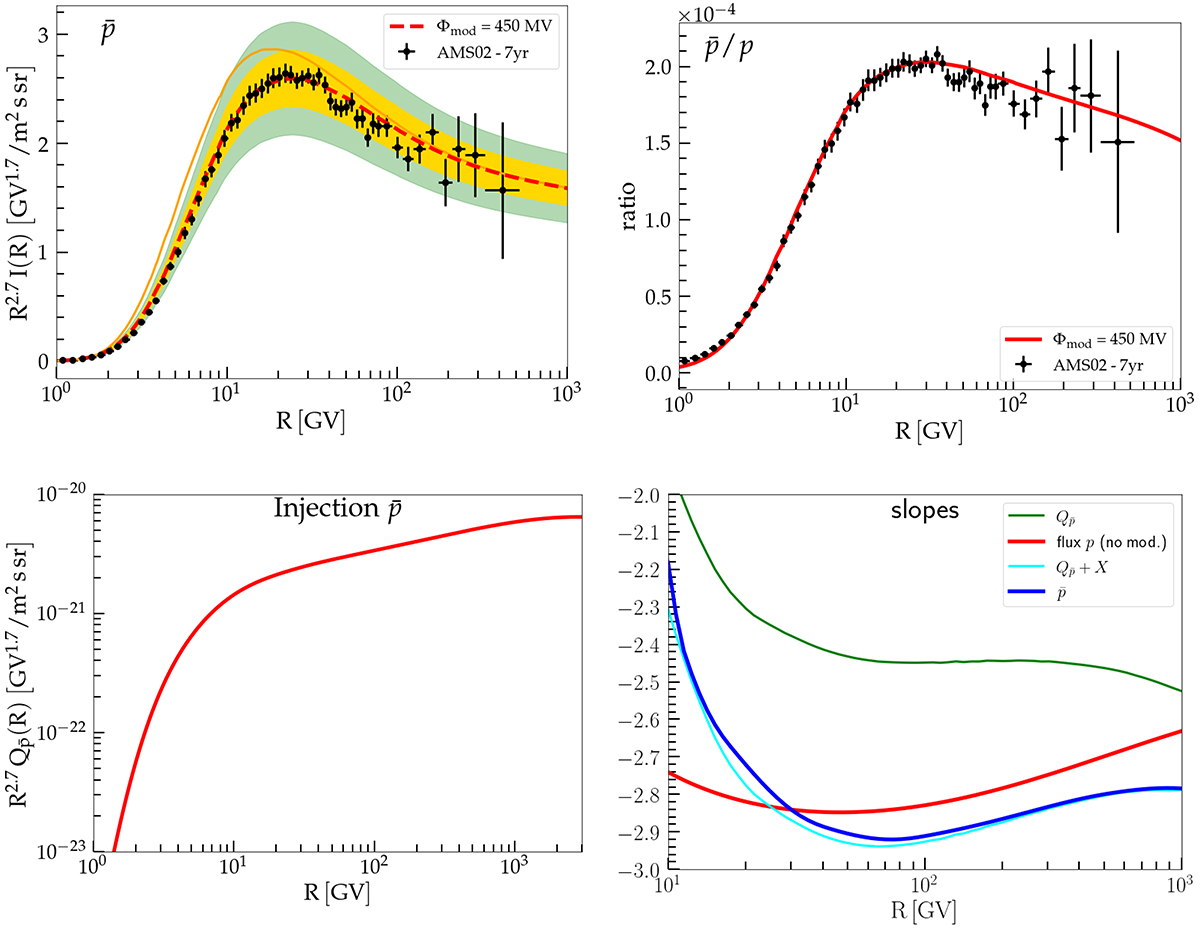
Antiprotons. Top left panel: Unmodulated (solid orange) and modulated (dashed red) p̄ flux compared to the data of AMS02 (Aguilar et al. 2021d, black dots). The yellow (green) shaded region corresponds to a 10% (20%) uncertainty in the production cross section. Top right panel: p̄/p ratio compared to the data of AMS02 (Aguilar et al. 2021d, black dots). Bottom left panel: p̄ source term, computed as in Eq. (23) and corresponding to the flux reported in the top left panel of the present figure. Bottom right panel: Slopes of the p̄ source term (solid green line), of p̄ flux (blue solid line), and of the proton flux (red solid line) reported in Fig. 4. The solid cyan curve corresponds to the sum of the slope of ![]() and of the grammage reported in Fig. 5.
and of the grammage reported in Fig. 5.
Current usage metrics show cumulative count of Article Views (full-text article views including HTML views, PDF and ePub downloads, according to the available data) and Abstracts Views on Vision4Press platform.
Data correspond to usage on the plateform after 2015. The current usage metrics is available 48-96 hours after online publication and is updated daily on week days.
Initial download of the metrics may take a while.