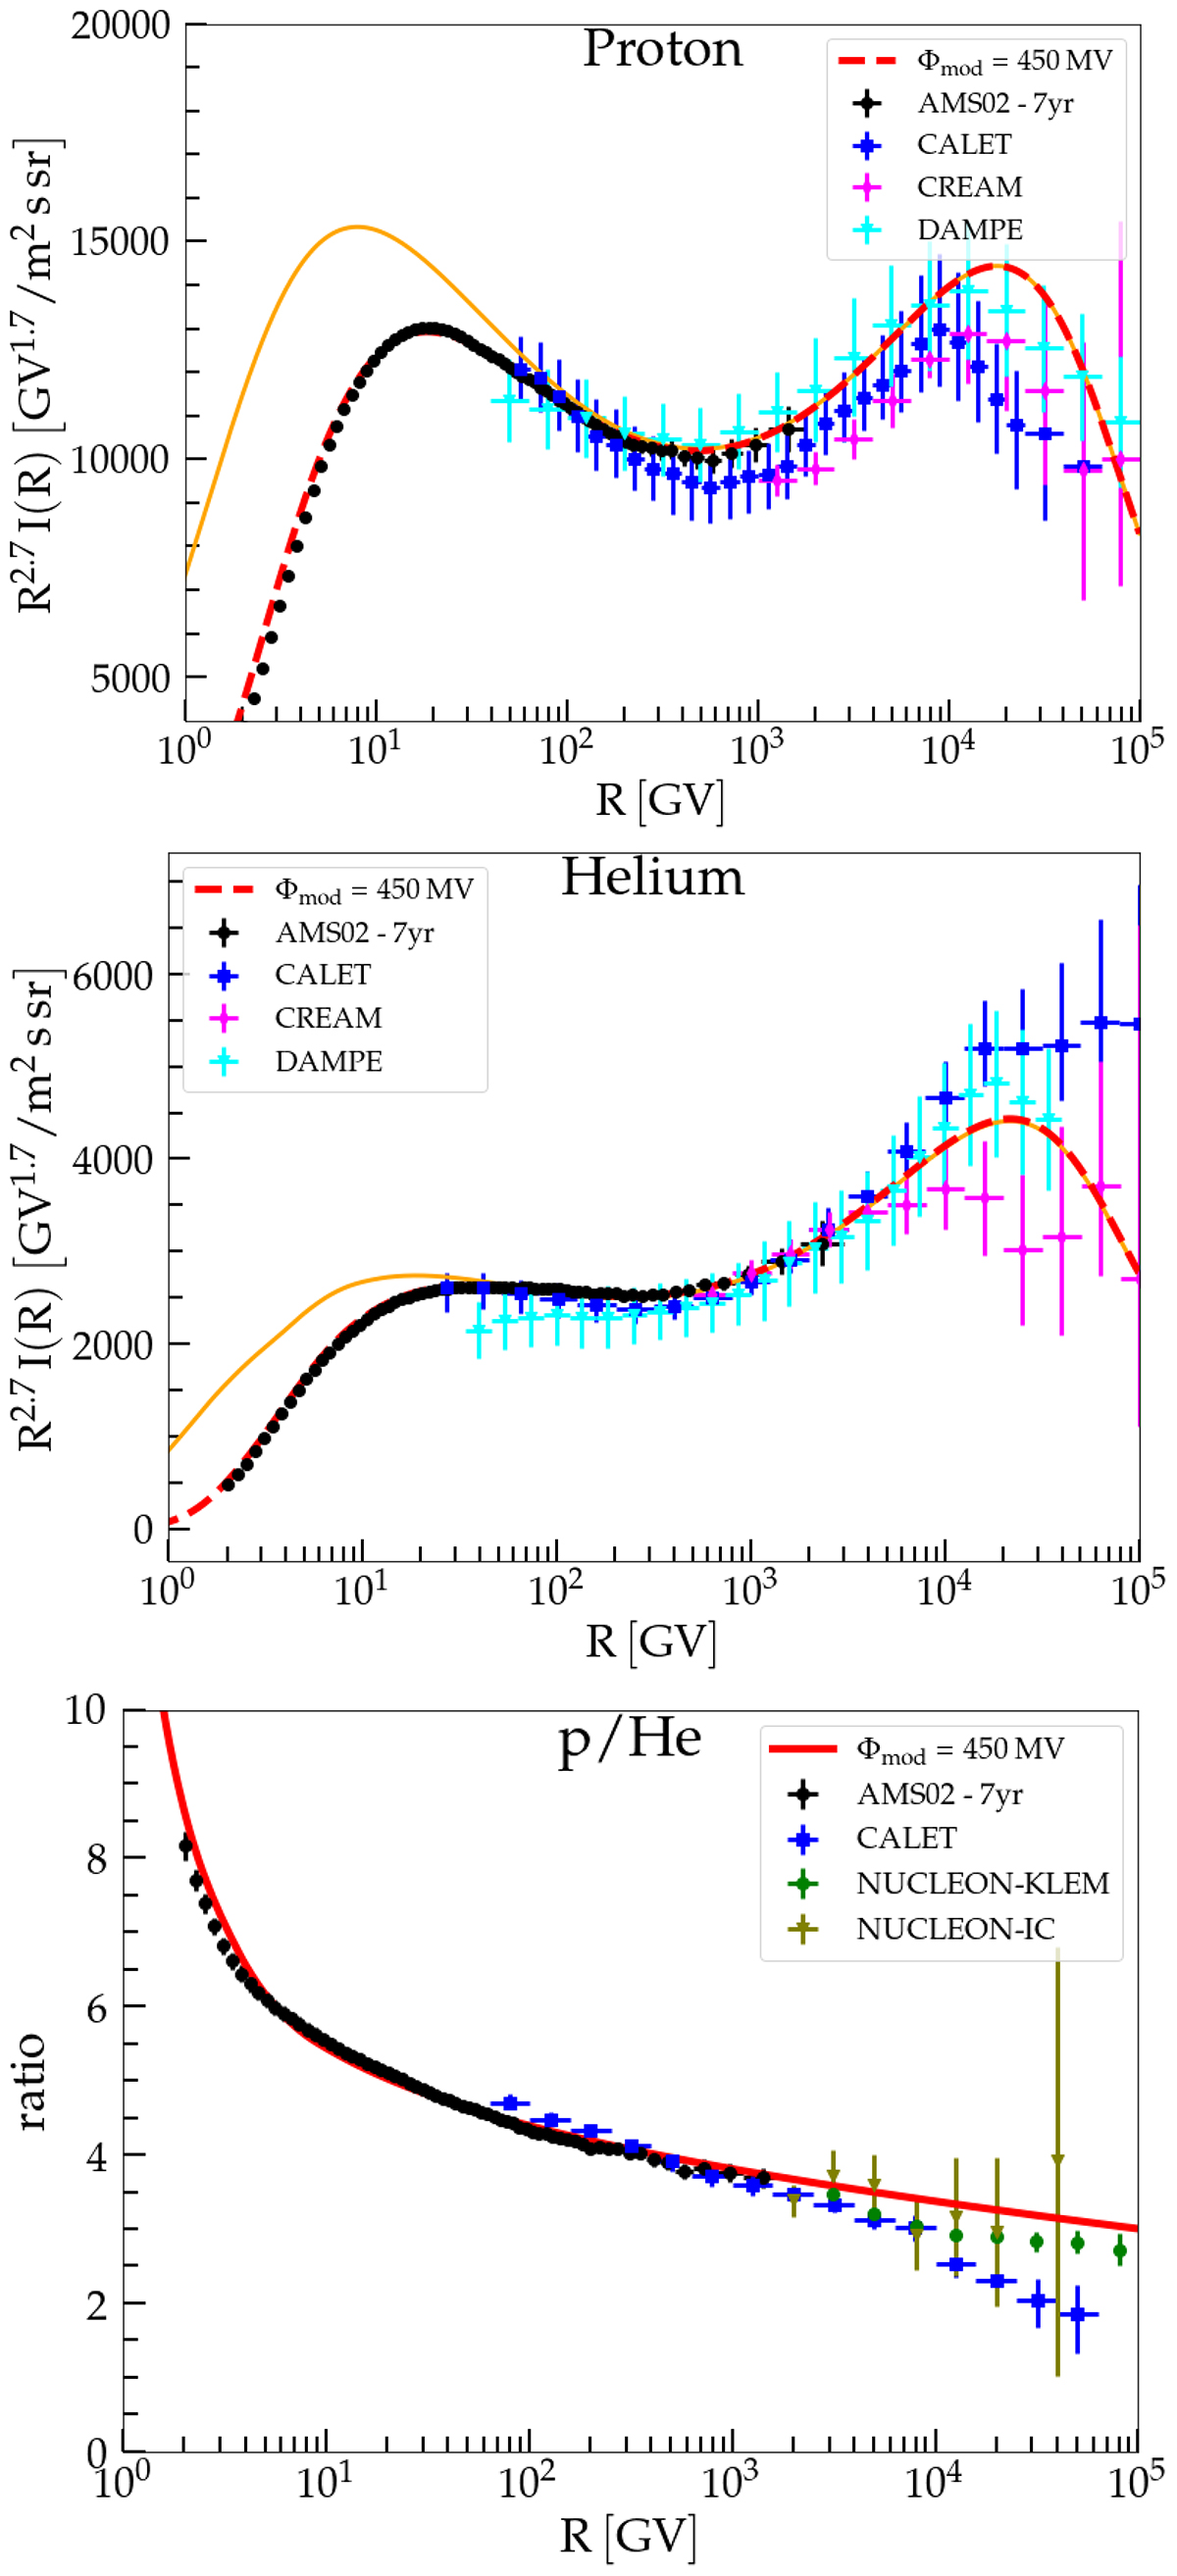
Fig. 4.
Download original image
Proton and helium fluxes in the range 1 − 105 TV. Top panel: Unmodulated (solid orange) and modulated (dashed red) proton flux compared to the data of AMS02 (Aguilar et al. 2021d, black dots), CALET (Adriani et al. 2022, blue squares), CREAM (Yoon et al. 2017, magenta diamonds), and DAMPE (An et al. 2019, cyan triangles). Middle panel: Unmodulated (solid orange) and modulated (dashed red) He flux compared to the data of AMS02 (Aguilar et al. 2021d, black dots), CALET (Adriani et al. 2023, blue squares), CREAM (Yoon et al. 2017, magenta diamonds), and DAMPE (Alemanno et al. 2021, cyan triangles). Bottom panel: p/He flux compared to the data of AMS02 (Aguilar et al. 2021d, black dots), CALET (Adriani et al. 2023, blue squares), and NUCLEON (Karmanov et al. 2020, green points).
Current usage metrics show cumulative count of Article Views (full-text article views including HTML views, PDF and ePub downloads, according to the available data) and Abstracts Views on Vision4Press platform.
Data correspond to usage on the plateform after 2015. The current usage metrics is available 48-96 hours after online publication and is updated daily on week days.
Initial download of the metrics may take a while.