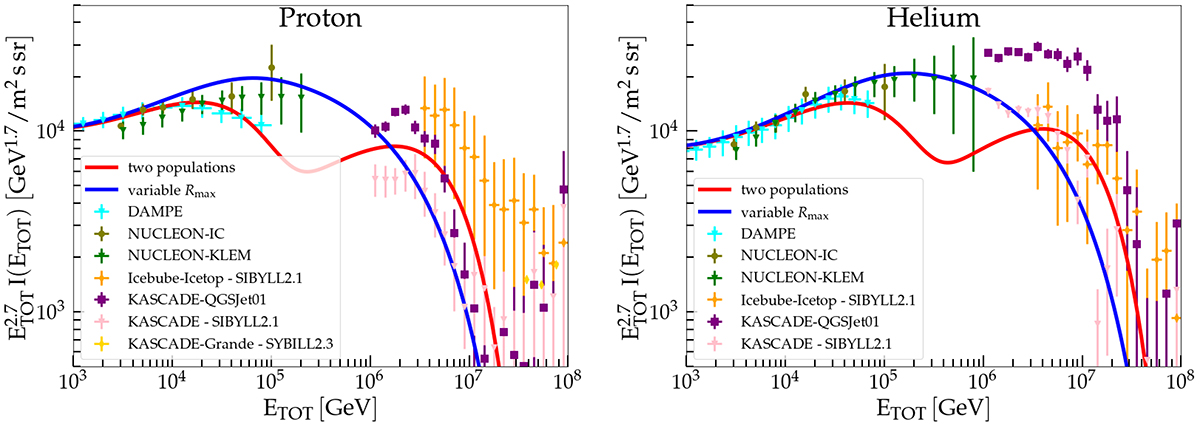
Fig. 6.
Download original image
Proton fluxes (left panel) and He fluxes (right panel) compared to the data of DAMPE (An et al. 2019; Alemanno et al. 2021, cyan triangles), NUCLEON (Grebenyuk et al. 2019a, green points), Icecube-Icetop (Aartsen et al. 2019, orange diamonds), KASCADE (Antoni et al. 2005, pink and violet points), and KASCADE-Grande (Arteaga-Velázquez et al. 2017, yellow points). The red curves correspond to the case with two source populations. The blue curves correspond to the case of a source CR luminosity decreasing with the increase in maximum rigidity.
Current usage metrics show cumulative count of Article Views (full-text article views including HTML views, PDF and ePub downloads, according to the available data) and Abstracts Views on Vision4Press platform.
Data correspond to usage on the plateform after 2015. The current usage metrics is available 48-96 hours after online publication and is updated daily on week days.
Initial download of the metrics may take a while.