Fig. 8.
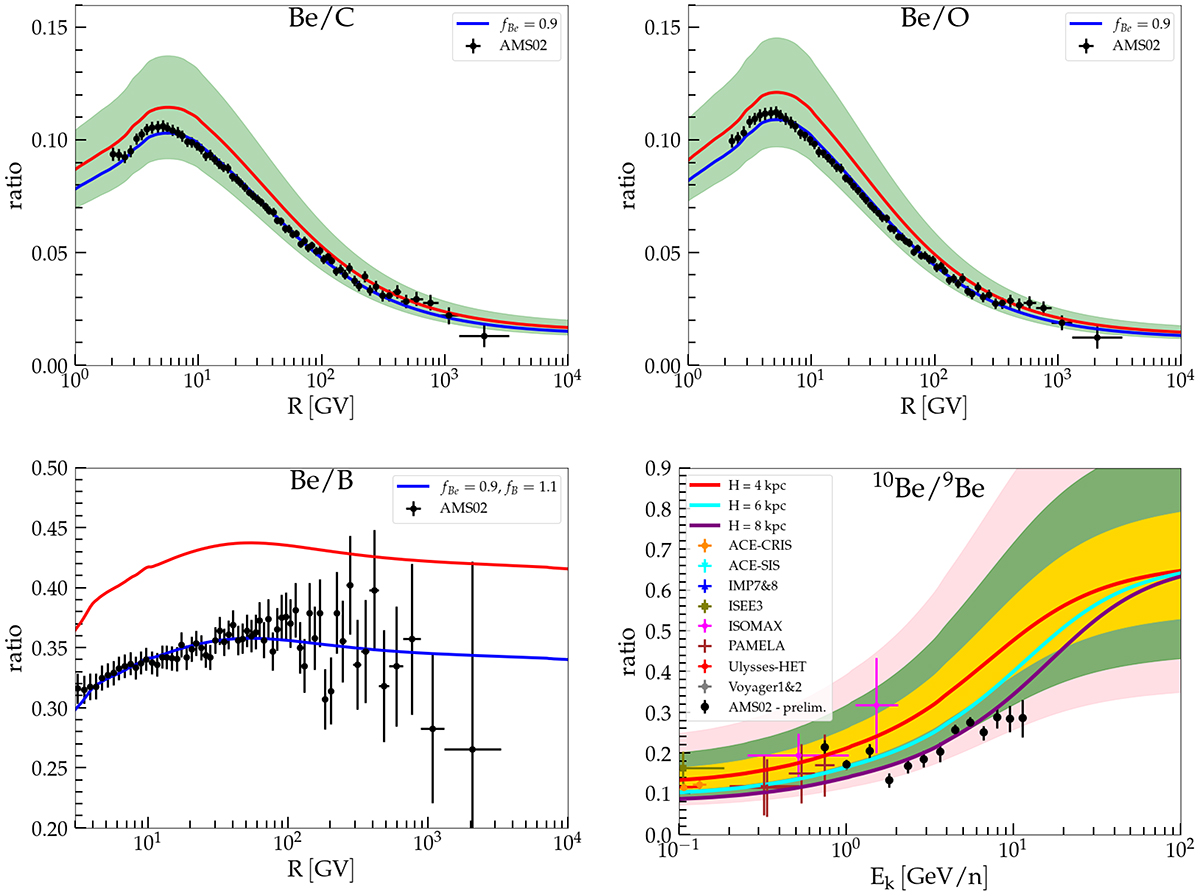
Download original image
Be/C (top left panel), Be/O (top right panel), and Be/B (bottom left panel) ratios (red solid line) compared to the data of AMS02 (Aguilar et al. 2018, 2021d, black dots). The green shaded region corresponds to a 20% uncertainty in the secondary production cross section. The solid blue line corresponds to the Be/C, Be/O, or Be/B ratio when the Be flux is multiplied by fBe = 0.9 and the B flux by fB = 1.9, as in Fig. 7. The 10Be/9Be ratio (bottom right panel) is compared to the preliminary AMS02 data (black dots) and to the data of a variety of other experiments, collected from the Cosmic-Ray Database (Maurin et al. 2023). The solid red line corresponds to a GH size of H = 4 kpc. The yellow, green, and pink shaded regions corresponds to a 10%, 20%, and 30% uncertainty in the production cross section, respectively. The solid cyan and purple lines correspond to H = 6 kpc and H = 8 kpc, respectively.
Current usage metrics show cumulative count of Article Views (full-text article views including HTML views, PDF and ePub downloads, according to the available data) and Abstracts Views on Vision4Press platform.
Data correspond to usage on the plateform after 2015. The current usage metrics is available 48-96 hours after online publication and is updated daily on week days.
Initial download of the metrics may take a while.