Fig. 4
Download original image
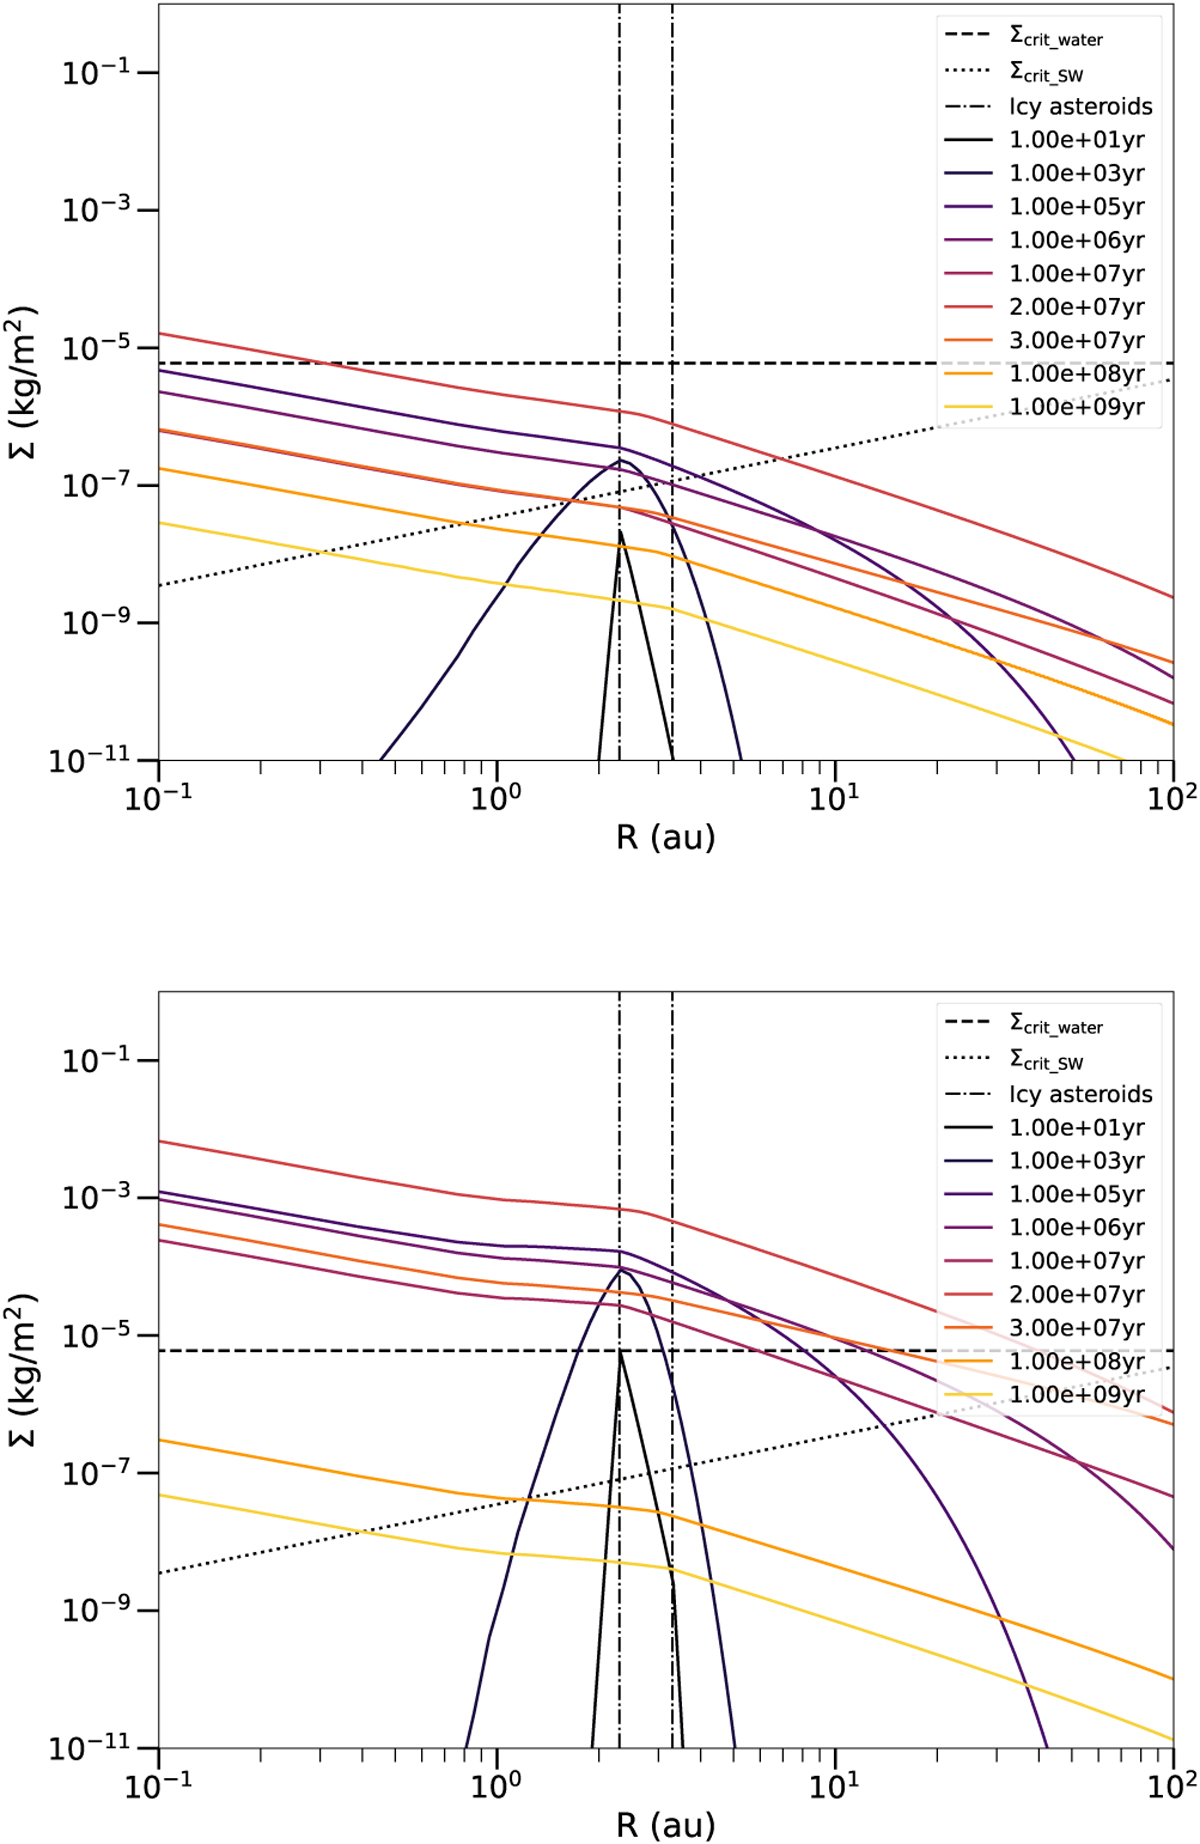
Evolution of the surface density profile as a function of time for scenario 1 (top) and scenario 2 (bottom). The different colours show the temporal evolution as indicated in the legend with brighter colours indicating later times. The dashed line is the density above which water is self-protected against dissociation and the dotted line is an upper limit of the critical density where gas will start to be blown away by the solar wind and create an outflow. The dash-dotted line shows the location of icy asteroids that release water in the belt.
Current usage metrics show cumulative count of Article Views (full-text article views including HTML views, PDF and ePub downloads, according to the available data) and Abstracts Views on Vision4Press platform.
Data correspond to usage on the plateform after 2015. The current usage metrics is available 48-96 hours after online publication and is updated daily on week days.
Initial download of the metrics may take a while.