Fig. 8
Download original image
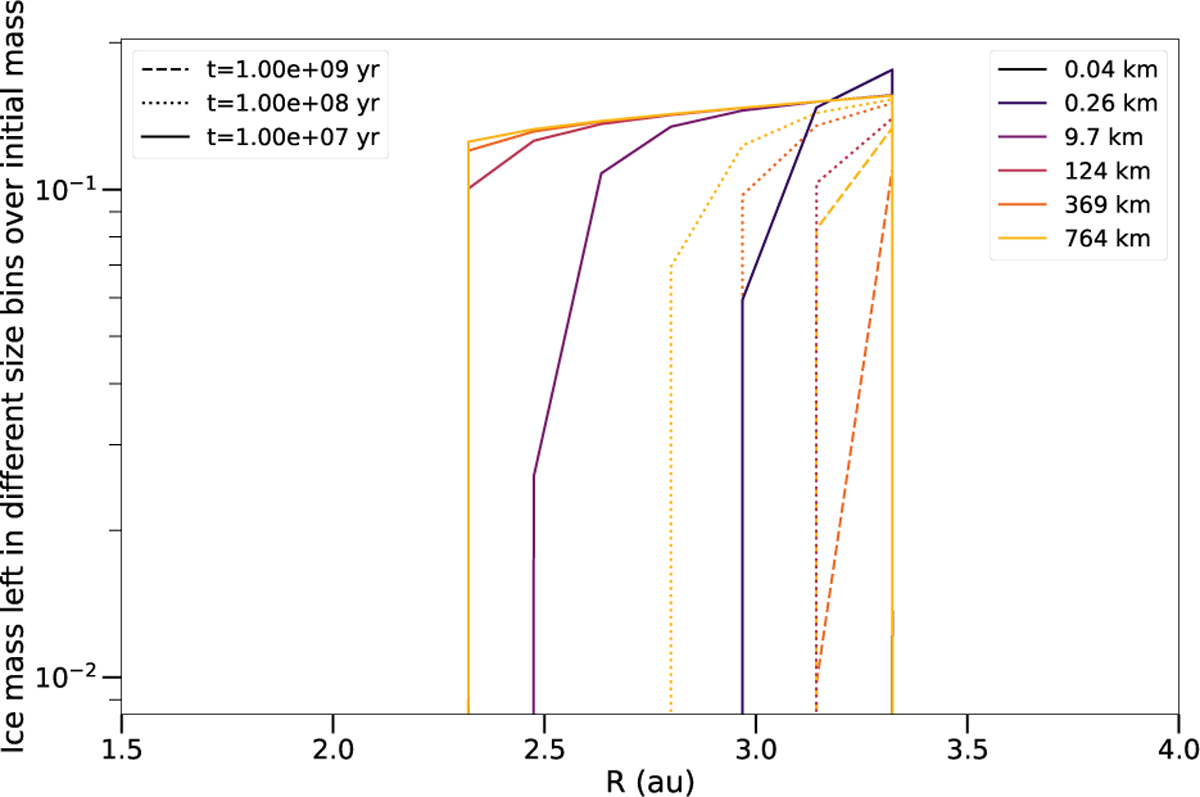
Ice mass left over total initial mass in different size bins (brighter colours are for larger objects) after 10 Myr (solid), 100 Myr (dotted) and lGyr (dashed) for the scenario 1. The smallest size bin (~40 m, black colour) never shows up on the plot as it gets depleted before 10 Myr.
Current usage metrics show cumulative count of Article Views (full-text article views including HTML views, PDF and ePub downloads, according to the available data) and Abstracts Views on Vision4Press platform.
Data correspond to usage on the plateform after 2015. The current usage metrics is available 48-96 hours after online publication and is updated daily on week days.
Initial download of the metrics may take a while.