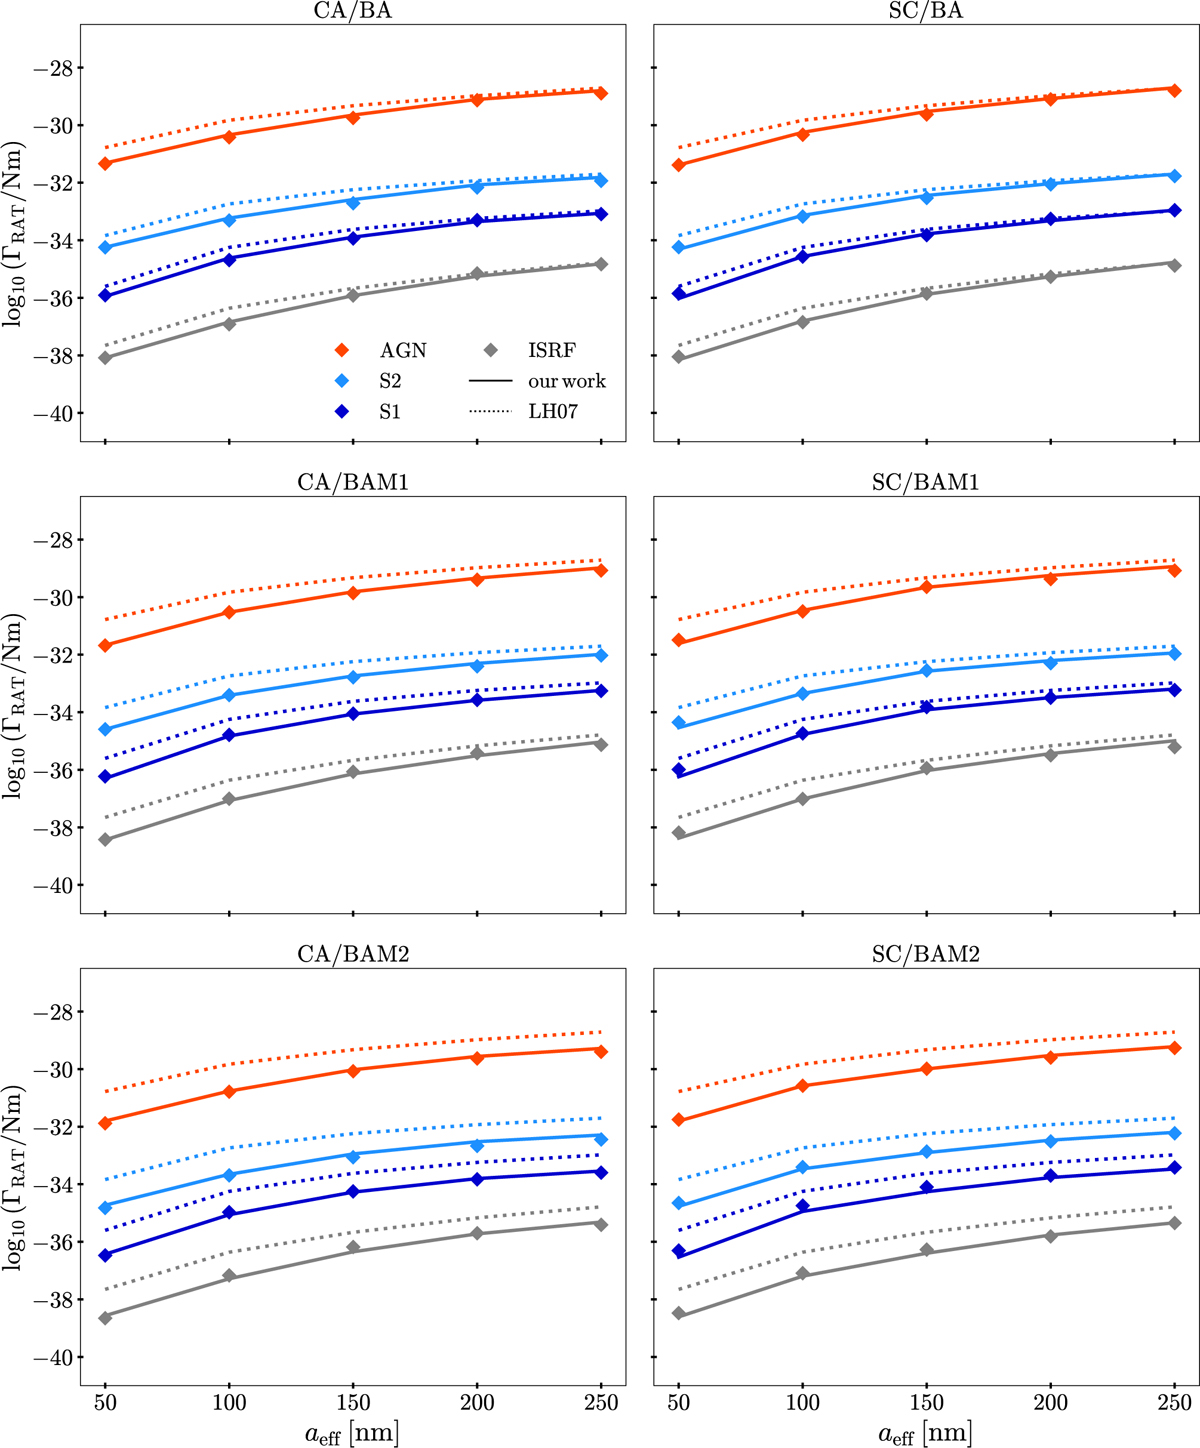
Fig. A.1
Download original image
RATs ΓRAT (solid line) per grain size aeff calculated with the two-power-law parametrization is shown in comparison to the RATs predicted by the canonical parametrization suggested in LH07 (dotted line) as well as the average of the DDSCAT simulation data (diamonds). Each color represents one of the different sources i.e. ISRF (gray), S1 (dark blue), S2 (light blue), or AGN (red), respectively, utilizing the CA grain material (left column) and the SC material (right column) with monomer-densities BA (top row), BAM (middle row), or BAM2 (bottom row). This figure is to be compared with Fig. 8.
Current usage metrics show cumulative count of Article Views (full-text article views including HTML views, PDF and ePub downloads, according to the available data) and Abstracts Views on Vision4Press platform.
Data correspond to usage on the plateform after 2015. The current usage metrics is available 48-96 hours after online publication and is updated daily on week days.
Initial download of the metrics may take a while.