Fig. 8
Download original image
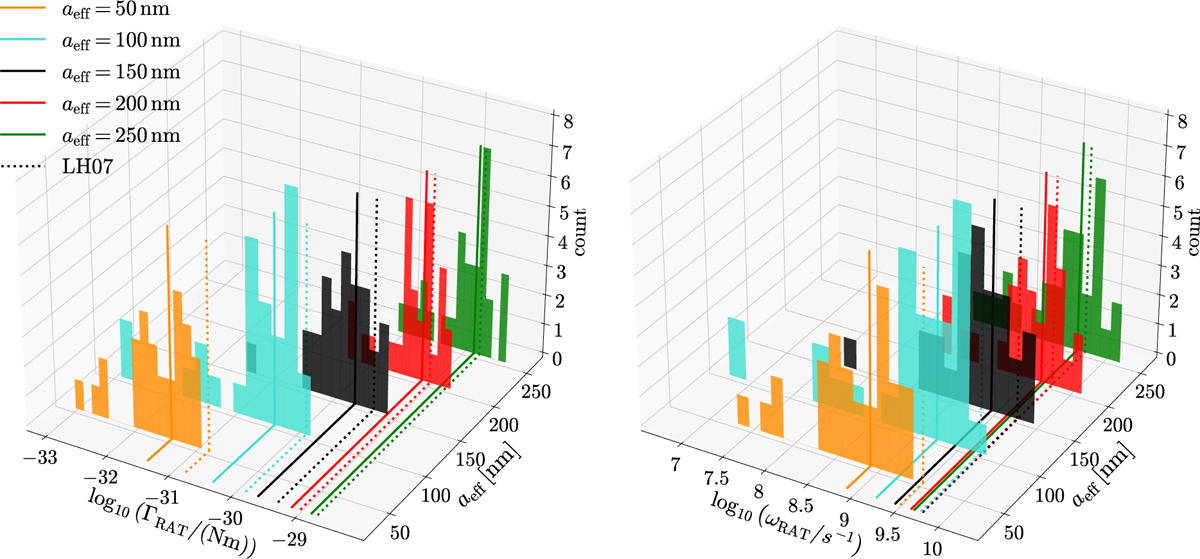
Histograms representing the distribution of the RAT ΓRAT (left) and angular velocity ωRAT (right) for SC BA grains of different sizes and the AGN as the radiation source. The continuous lines show the mean for each distribution, and the dotted lines show the value calculated using the canonical parameterization (LH07). The mean values for ωRAT are calculated from the mean values of ΓRAT shown in the lower panel as well as averages for τdrag and Imax. We note that the RATs by the canonical parameterization are consistently higher than the mean values of the dust aggregates.
Current usage metrics show cumulative count of Article Views (full-text article views including HTML views, PDF and ePub downloads, according to the available data) and Abstracts Views on Vision4Press platform.
Data correspond to usage on the plateform after 2015. The current usage metrics is available 48-96 hours after online publication and is updated daily on week days.
Initial download of the metrics may take a while.