Fig. 2
Download original image
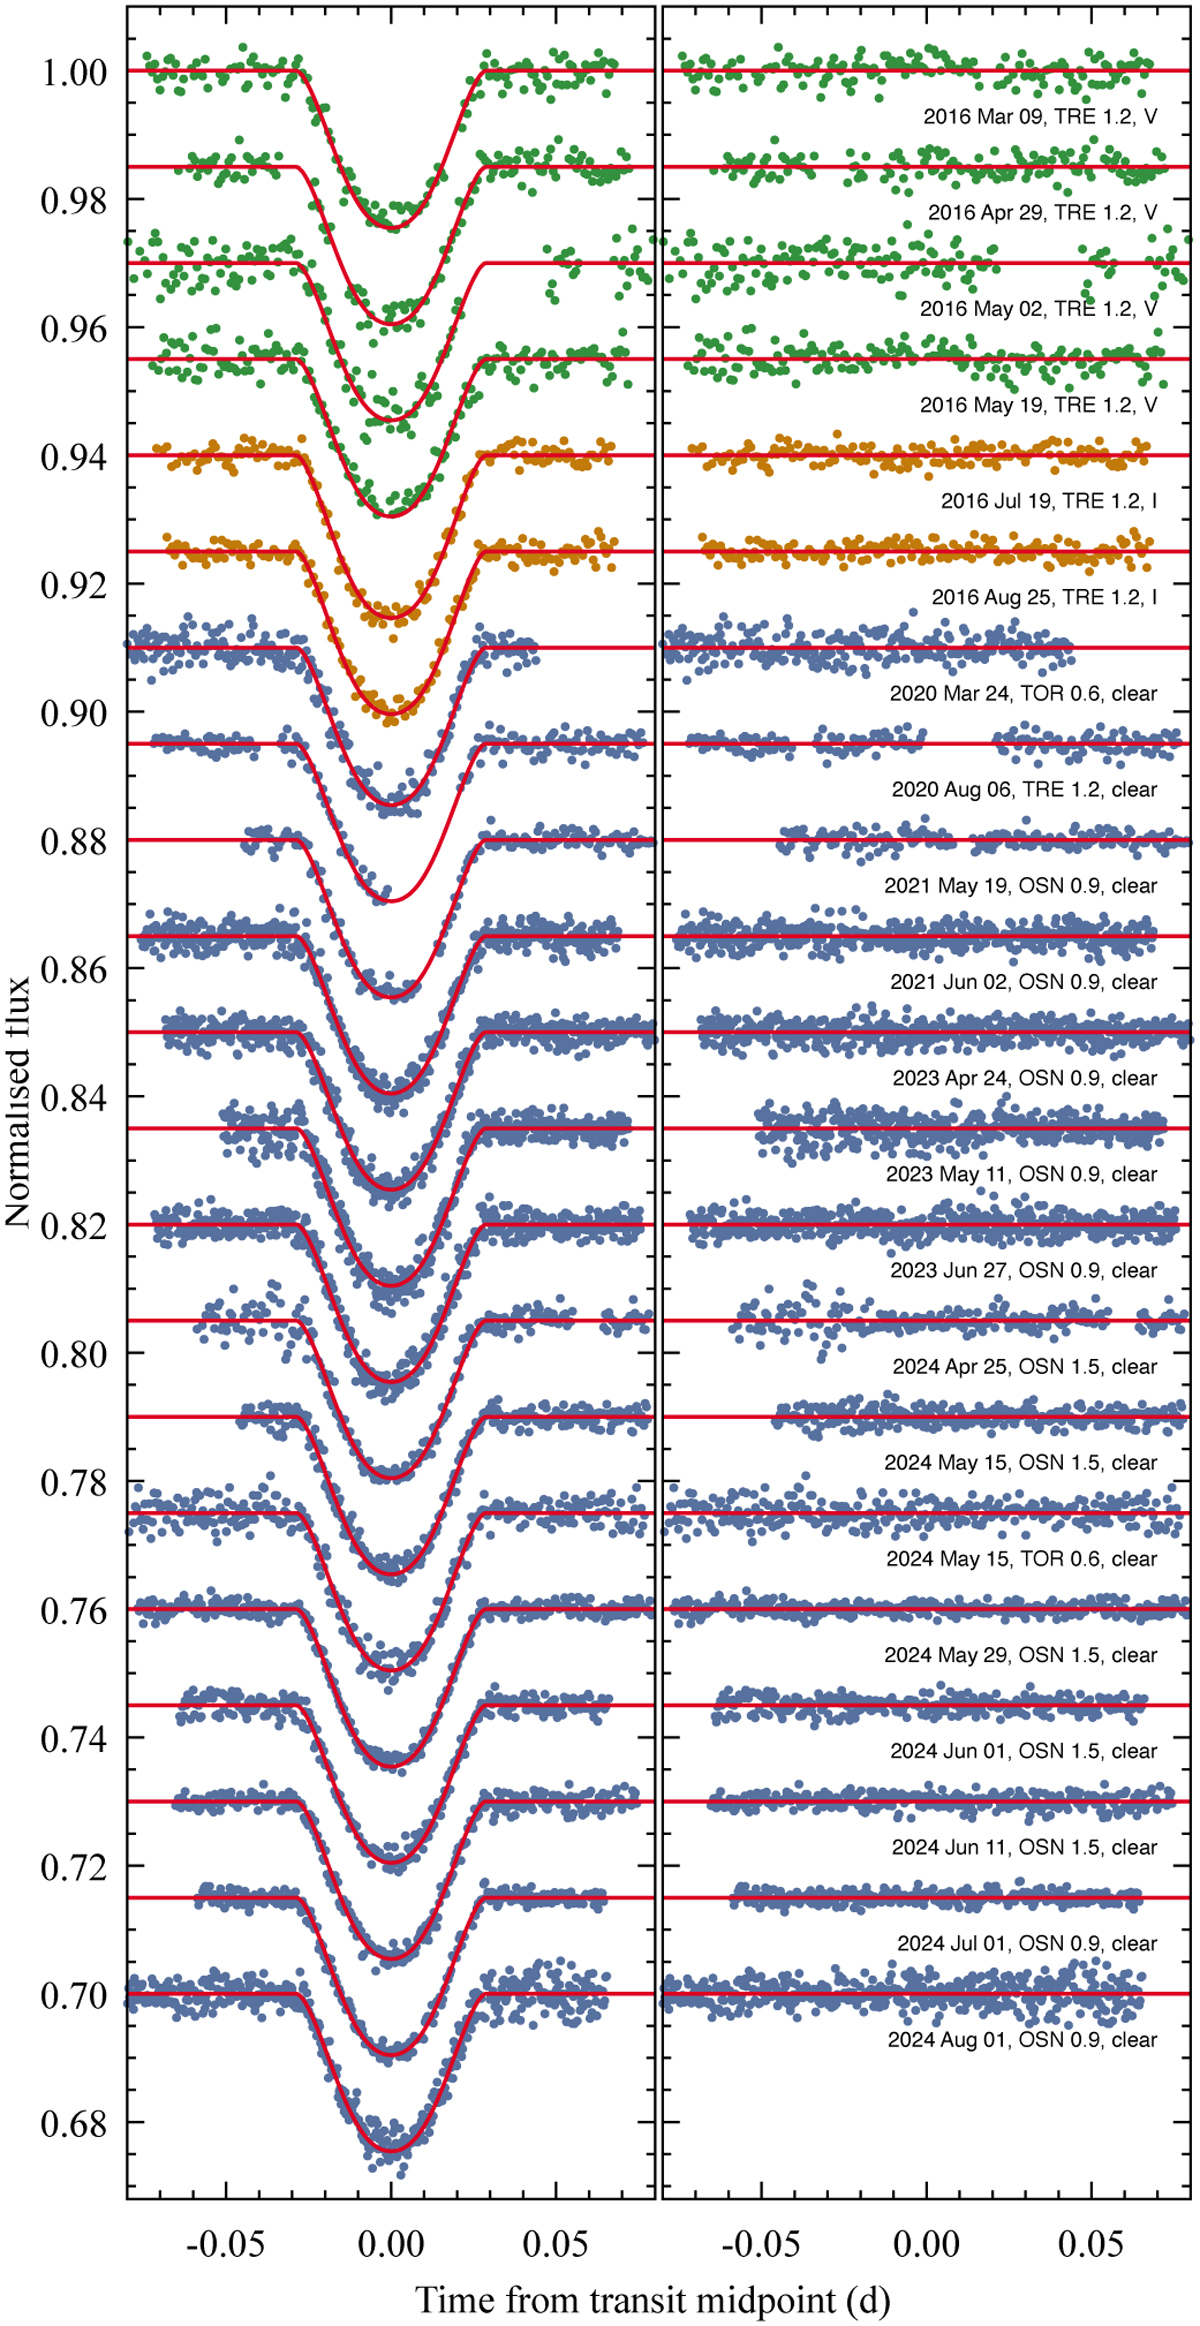
New ground-based transit light curves for TrES-3 b. Left: individual photometric time series sorted by the observation date. The V-band data are marked with green points, the I-band data are marked with orange points, and the white-light (clear filter) data are marked with blue points. The best-fitting models (Sect. 3.1) are drawn with red lines. Right: photometric residuals from the transit model.
Current usage metrics show cumulative count of Article Views (full-text article views including HTML views, PDF and ePub downloads, according to the available data) and Abstracts Views on Vision4Press platform.
Data correspond to usage on the plateform after 2015. The current usage metrics is available 48-96 hours after online publication and is updated daily on week days.
Initial download of the metrics may take a while.