Fig. 5
Download original image
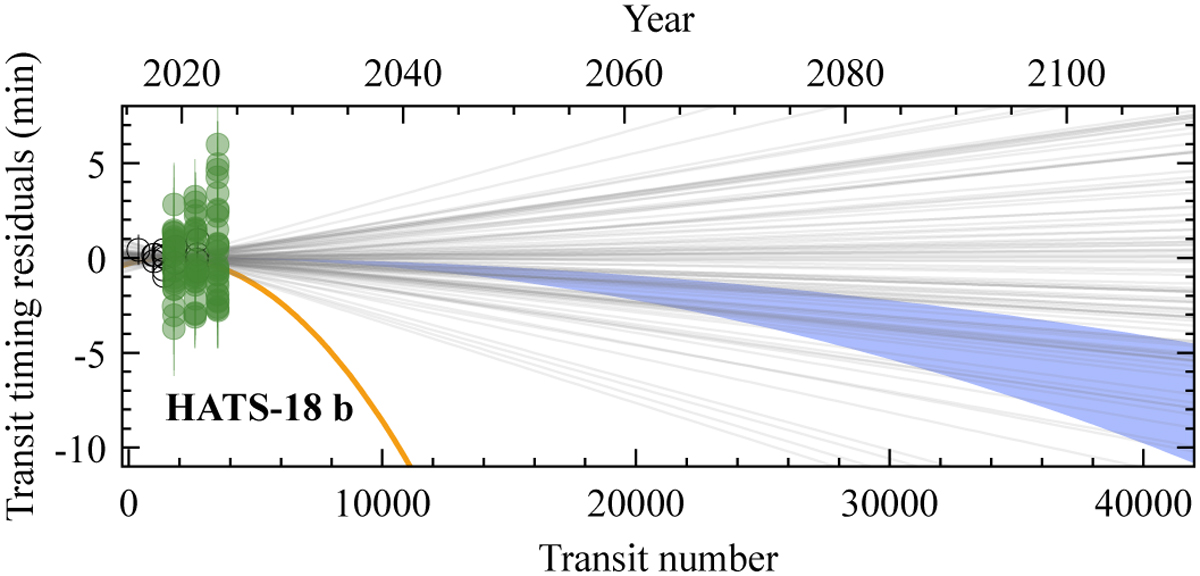
Predicted departure from the current linear transit ephemeris for HATS-18 b. The mustard line traces the dissipation through the WNL effects for Q′⋆,WNL ≈ 5.5 × 10⁵ derived from Weinberg et al. (2024). A blue area illustrates predictions of the gyrochronological analysis by Penev et al. (2016) with Q′⋆ between 1.0 × 10⁷ (lower envelope) and 2. 4 × 10⁷ (upper envelope). The data points are the same as in Fig. 3. The uncertainties of the linear ephemeris are illustrated with 100 lines drawn from the posterior distribution.
Current usage metrics show cumulative count of Article Views (full-text article views including HTML views, PDF and ePub downloads, according to the available data) and Abstracts Views on Vision4Press platform.
Data correspond to usage on the plateform after 2015. The current usage metrics is available 48-96 hours after online publication and is updated daily on week days.
Initial download of the metrics may take a while.