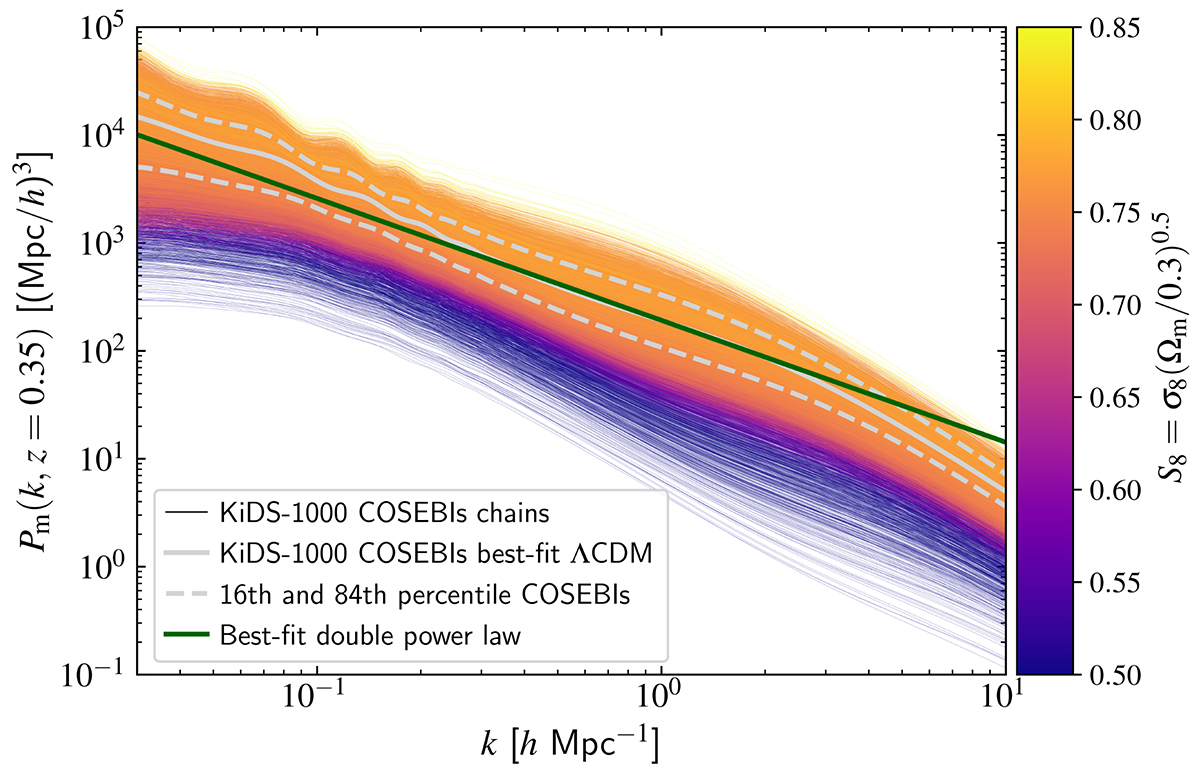
Fig. 3.
Download original image
Matter power spectrum at z = 0.35. The colored curves show the predictions from the KiDS-1000 COSEBIs chains from Asgari et al. (2021), and they are color-coded by their value of S8 (see the color bar). The solid and dashed gray curves show the best-fitting and 16th and 84th percentiles of the KiDS-1000 inference, respectively. The green solid curve shows the best-fitting prediction of the AIA = 1 double power-law model assumed in this work.
Current usage metrics show cumulative count of Article Views (full-text article views including HTML views, PDF and ePub downloads, according to the available data) and Abstracts Views on Vision4Press platform.
Data correspond to usage on the plateform after 2015. The current usage metrics is available 48-96 hours after online publication and is updated daily on week days.
Initial download of the metrics may take a while.