Open Access
Fig. A.6.
Download original image
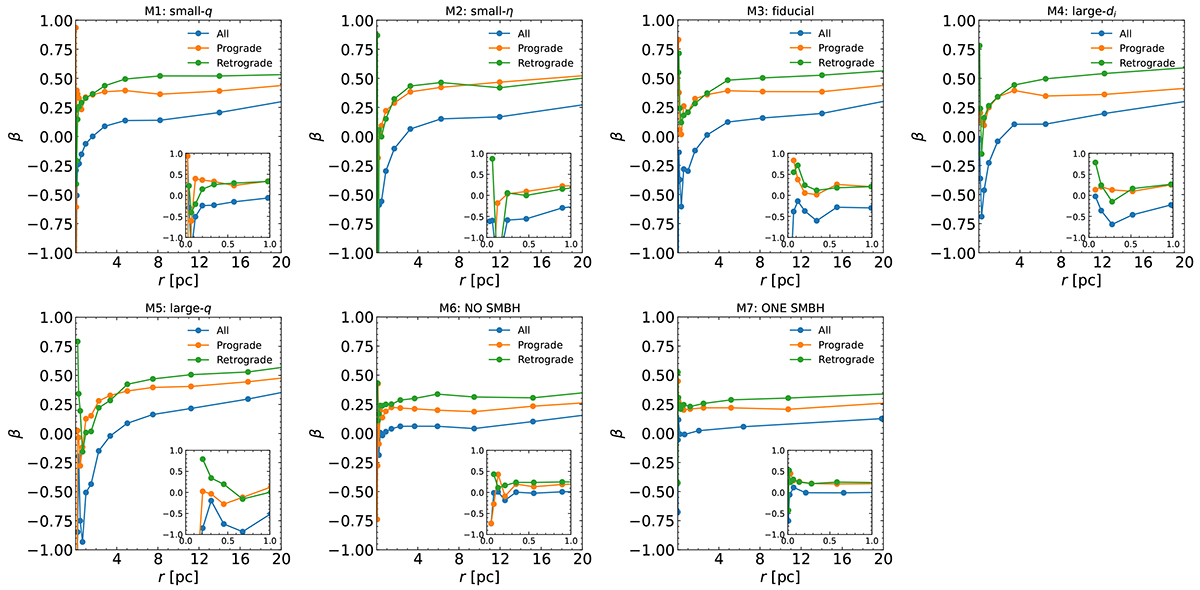
Velocity anisotropy parameter β for the entire cluster (blue) as well as for the prograde (orange) and retrograde (green) populations. The behaviour of β depends on the initial conditions adopted for each model. The inset in each panel shows the behaviour of β in the cluster central regions.
Current usage metrics show cumulative count of Article Views (full-text article views including HTML views, PDF and ePub downloads, according to the available data) and Abstracts Views on Vision4Press platform.
Data correspond to usage on the plateform after 2015. The current usage metrics is available 48-96 hours after online publication and is updated daily on week days.
Initial download of the metrics may take a while.