Fig. 9.
Download original image
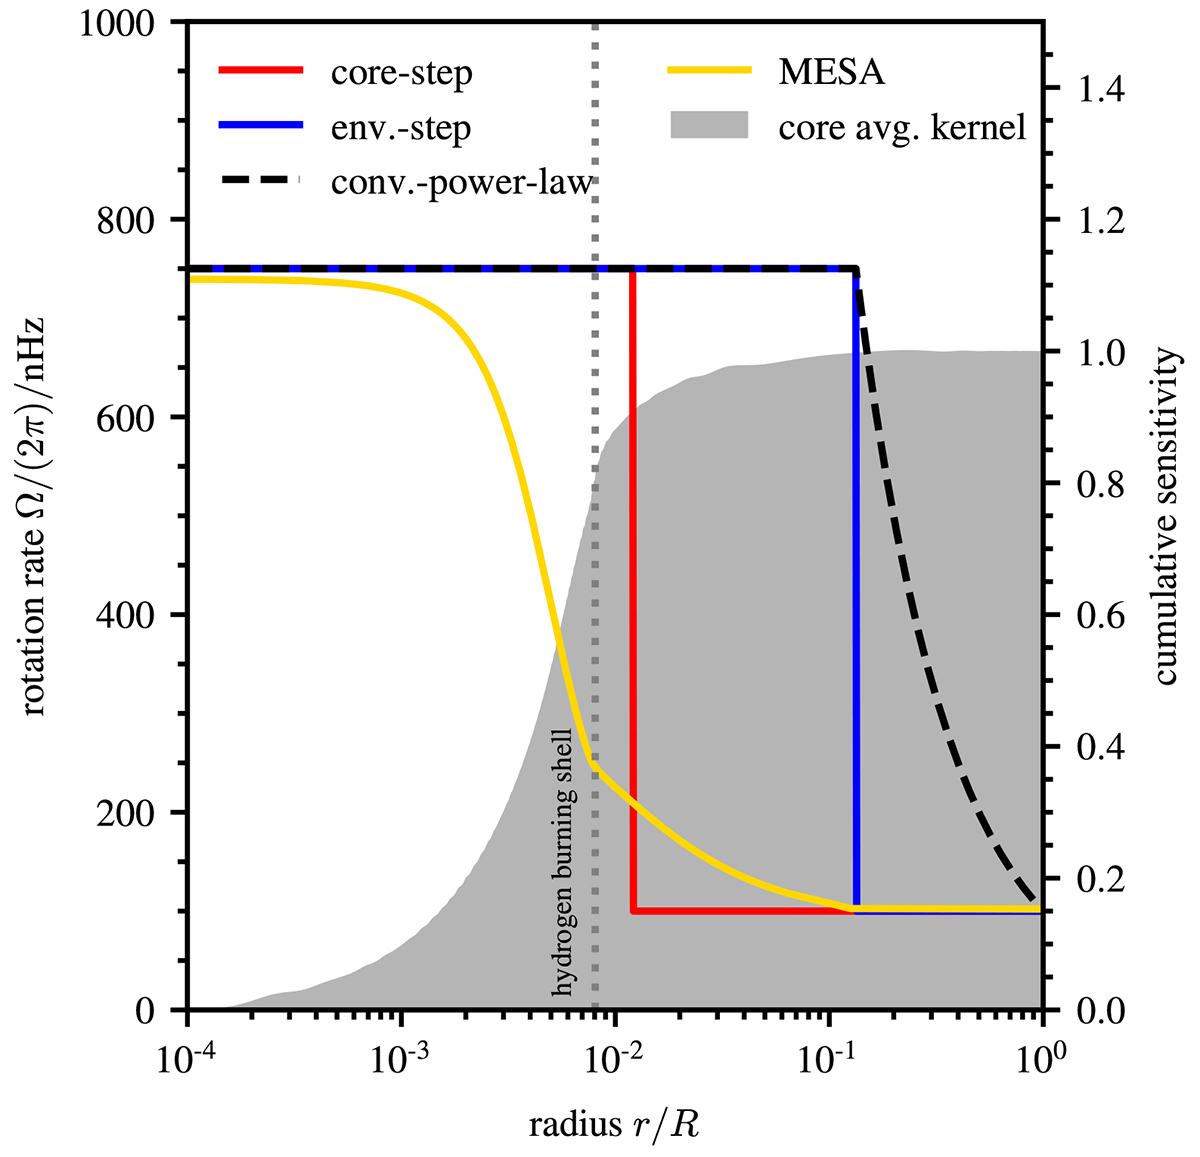
Rotation profiles as a function of fractional radius. Note that the radius is shown on a logarithmic scale. We show the three synthetic profiles used in this work in red, blue and black. The profile of the rotating MESA model is shown in yellow. We use Ωcore/(2π) = 750 nHz and Ωenv/(2π) = 100 nHz as default values for the synthetic rotation profiles. The vertical dotted line indicates the location of the hydrogen burning shell. The cumulative core averaging kernel of the fiducial model is shown with the grey shaded area.
Current usage metrics show cumulative count of Article Views (full-text article views including HTML views, PDF and ePub downloads, according to the available data) and Abstracts Views on Vision4Press platform.
Data correspond to usage on the plateform after 2015. The current usage metrics is available 48-96 hours after online publication and is updated daily on week days.
Initial download of the metrics may take a while.