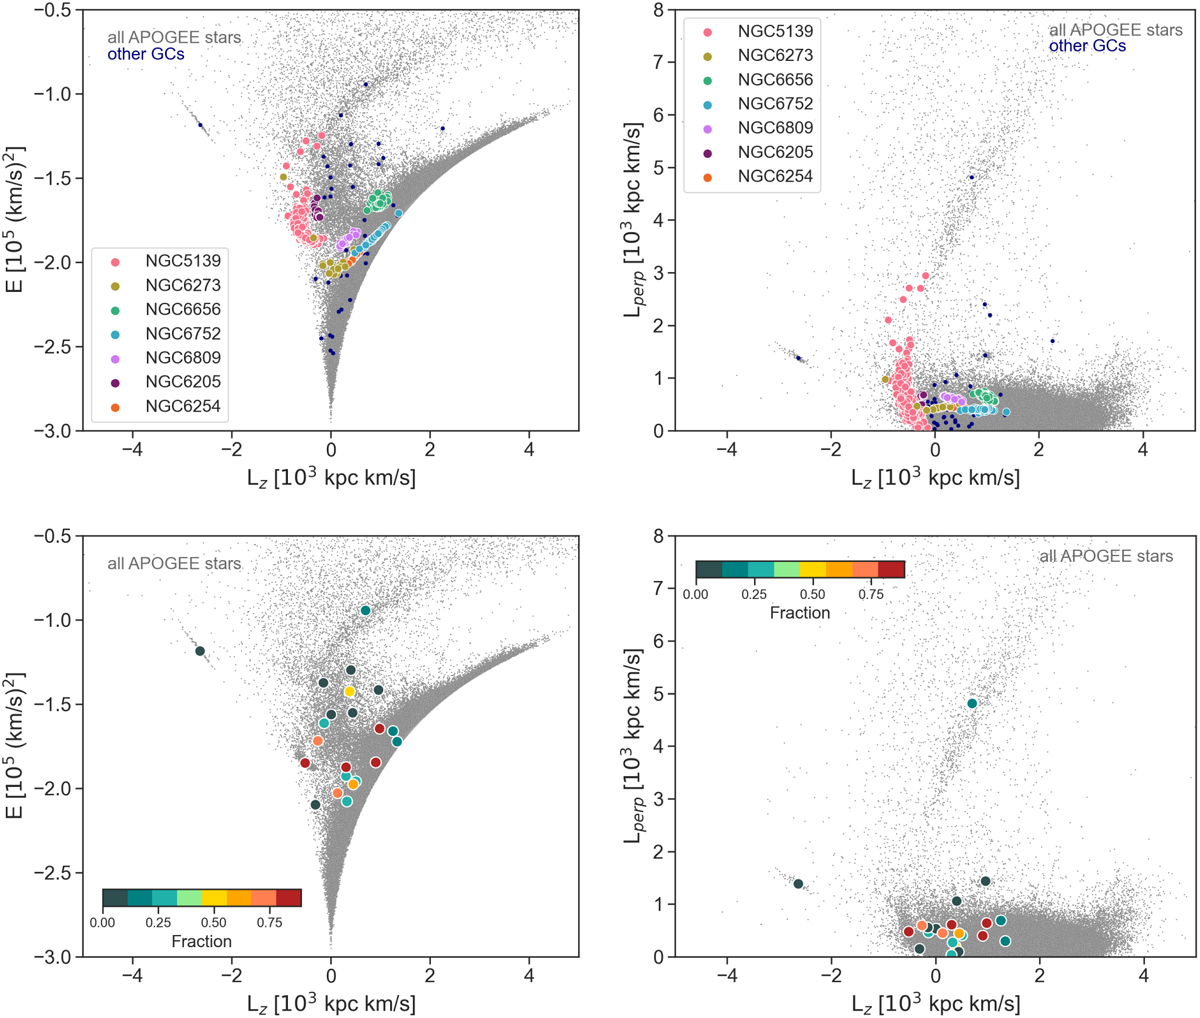
Fig. 7
Download original image
Distribution of GCs and field stars in kinematic spaces: orbital energy (E) and projection of the total angular momentum onto the Galactic plane (Lperp) vs. the z component of the angular momentum (Lz). Top panel: star-by-star distribution in the E – Lz and Lperp – Lz spaces of GCs for which at least 60% of the stars are chemically compatible with ω Cen. Other GCs in our sample are shown as blue points (mean values). Bottom panel: distribution in the E – Lz and Lperp – Lz spaces of GCs, which are colour-coded according to the fraction of stars that are chemically compatible with ω Cen (see Table 1). Only GCs with a total number of stars greater than 15 are shown. For comparison, in both panels, the distribution of all APOGEE stars is shown as grey points. Note that the sign of Lz has been inverted from the usual sign of Lz in a right-handed system to enable a better comparison with other works in the literature.
Current usage metrics show cumulative count of Article Views (full-text article views including HTML views, PDF and ePub downloads, according to the available data) and Abstracts Views on Vision4Press platform.
Data correspond to usage on the plateform after 2015. The current usage metrics is available 48-96 hours after online publication and is updated daily on week days.
Initial download of the metrics may take a while.