Fig. C.2
Download original image
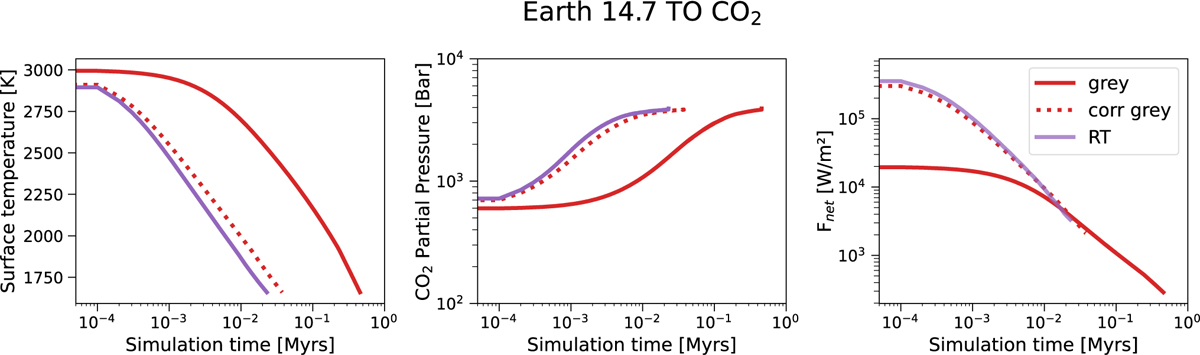
Simulation of MagmOcV2.0 for Earth and 14.7 TO CO2 content for a 2000 km deep magma ocean. Depicted from left to right: Surface temperature, H2O atmosphere surface pressure, and net flux at the top of the atmosphere (FOLR – FASR) for three different atmosphere models. These models are the gray model without any correction (solid red line), the corrected gray model (dotted red line), and the RT adaptation (solid purple line).
Current usage metrics show cumulative count of Article Views (full-text article views including HTML views, PDF and ePub downloads, according to the available data) and Abstracts Views on Vision4Press platform.
Data correspond to usage on the plateform after 2015. The current usage metrics is available 48-96 hours after online publication and is updated daily on week days.
Initial download of the metrics may take a while.