Fig. 6
Download original image
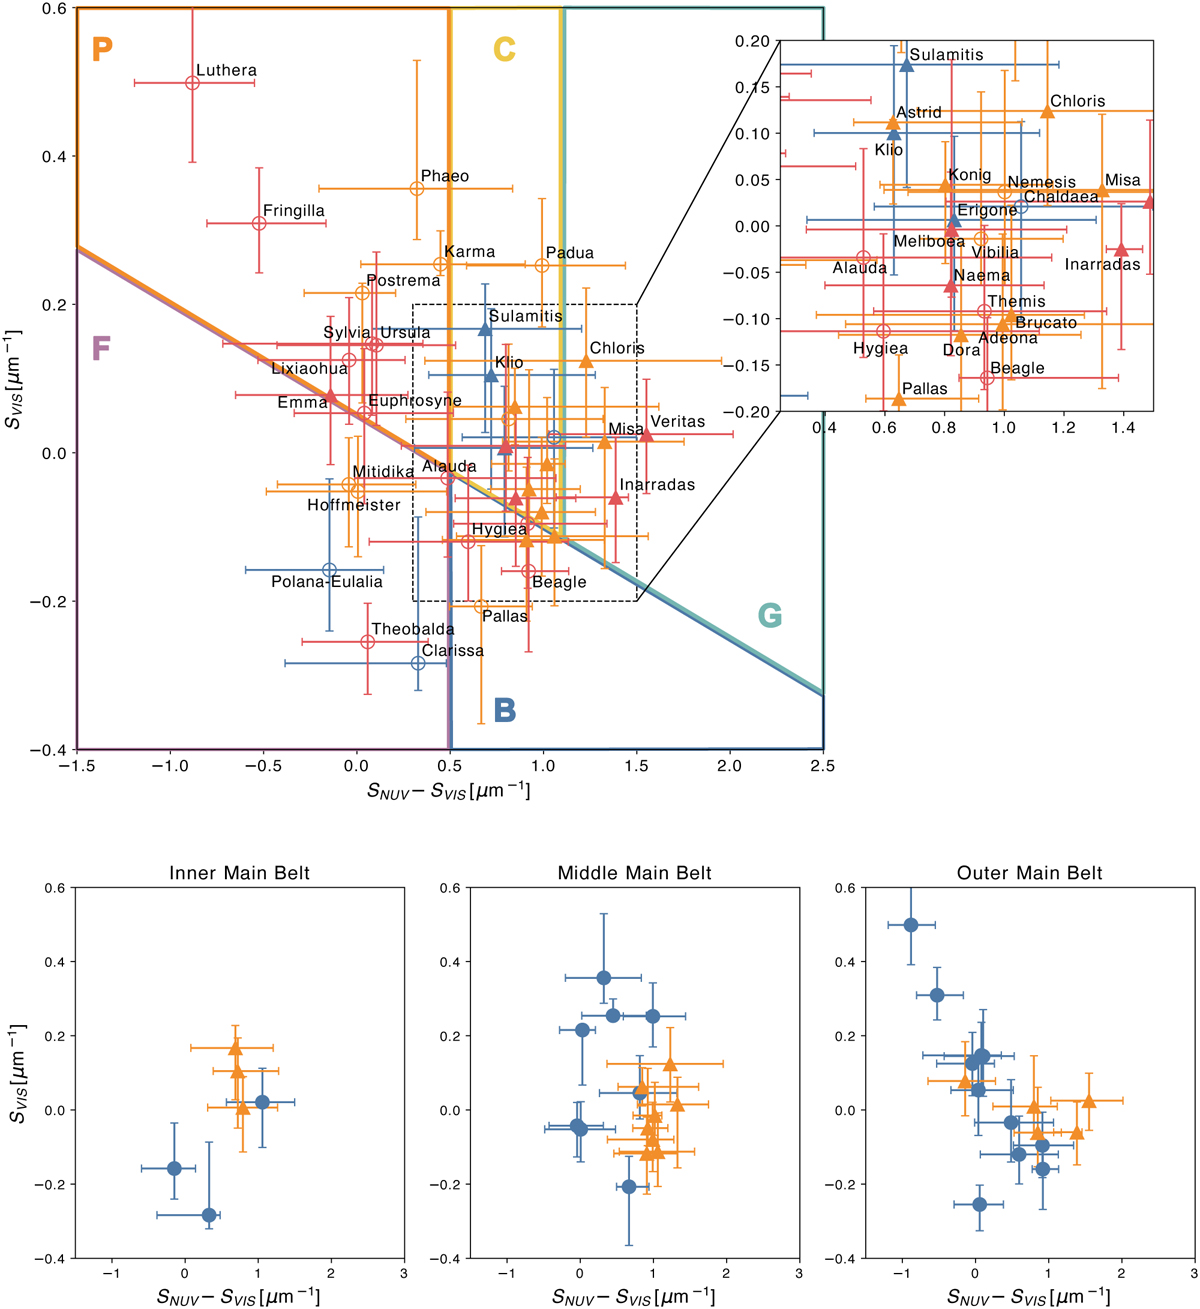
NUV-VIS distribution of primitive asteroid families. The x-axis shows the NUV absorption calculated from the difference in the spectral slope of VIS and NUV and the y-axis shows the VIS spectral slope. The symbols and error bars show the median values and interquartile ranges. The circles are the families with HYD < 0 and the triangles are those with HYD > 0 (highly hydrated). (top) All the primitive asteroid families in this study are shown (blue: IMB, orange: MMB, red: OMB). Tholen’s taxonomic classification, which is applied in Tatsumi et al. (2023), is also shown as divided zones labeled with the names of classes. (bottom) The same plot as the top plot with the three regions of the main belt separately shown. The blue circles are HYD<0 and the orange triangles are HYD>0.
Current usage metrics show cumulative count of Article Views (full-text article views including HTML views, PDF and ePub downloads, according to the available data) and Abstracts Views on Vision4Press platform.
Data correspond to usage on the plateform after 2015. The current usage metrics is available 48-96 hours after online publication and is updated daily on week days.
Initial download of the metrics may take a while.