Fig. 13
Download original image
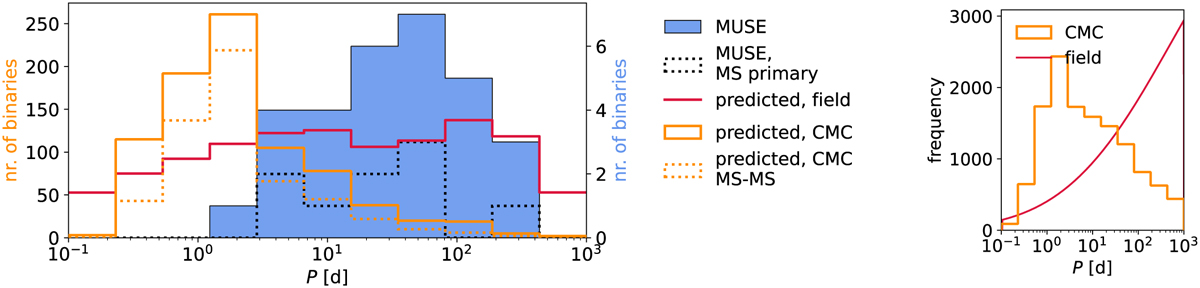
Period distribution of binaries with well-constrained orbits in 47 Tuc (shown in blue). The dotted line represents the subset of binaries with MS primaries. For comparison, the orange lines depict the period distributions of hypothetically detectable binaries from the CMC simulation (stellar types as shown in Fig. 7), with the dashed line indicating the subset of simulated MS-MS binaries. The red curve illustrates the predicted observable distribution assuming an underlying field-like period distribution with ![]() and standard deviation σlog P ≈ 2.3. It is scaled to the number of well-constrained MUSE binaries. For CMC and field binaries, we have forward-modeled our selection function to account for decreasing sensitivity at longer periods. The underlying period distributions of field and CMC binaries are shown for reference in the right-hand panel.
and standard deviation σlog P ≈ 2.3. It is scaled to the number of well-constrained MUSE binaries. For CMC and field binaries, we have forward-modeled our selection function to account for decreasing sensitivity at longer periods. The underlying period distributions of field and CMC binaries are shown for reference in the right-hand panel.
Current usage metrics show cumulative count of Article Views (full-text article views including HTML views, PDF and ePub downloads, according to the available data) and Abstracts Views on Vision4Press platform.
Data correspond to usage on the plateform after 2015. The current usage metrics is available 48-96 hours after online publication and is updated daily on week days.
Initial download of the metrics may take a while.