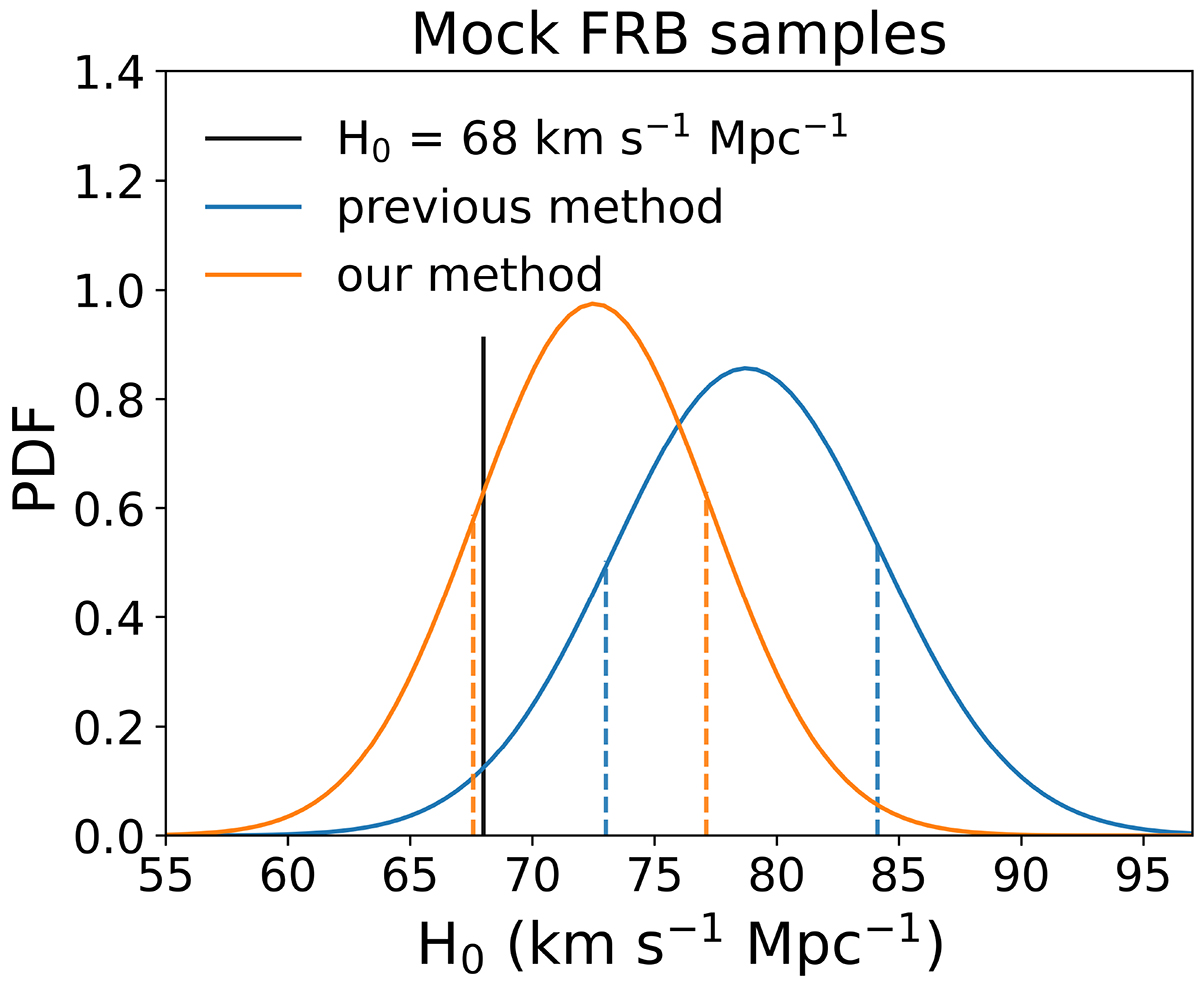
Fig. 8.
Download original image
PDFs of H0 derived by our method (orange) with positive and negative standard deviations (orange vertical dashed lines) and the previous method (blue) with positive and negative standard deviations (vertical dashed blue lines), using the same 100 mock FRB data. The vertical black line indicates H0 = 68.0 km s−1 Mpc−1, which was assumed when we generated the 100 mock FRBs.
Current usage metrics show cumulative count of Article Views (full-text article views including HTML views, PDF and ePub downloads, according to the available data) and Abstracts Views on Vision4Press platform.
Data correspond to usage on the plateform after 2015. The current usage metrics is available 48-96 hours after online publication and is updated daily on week days.
Initial download of the metrics may take a while.