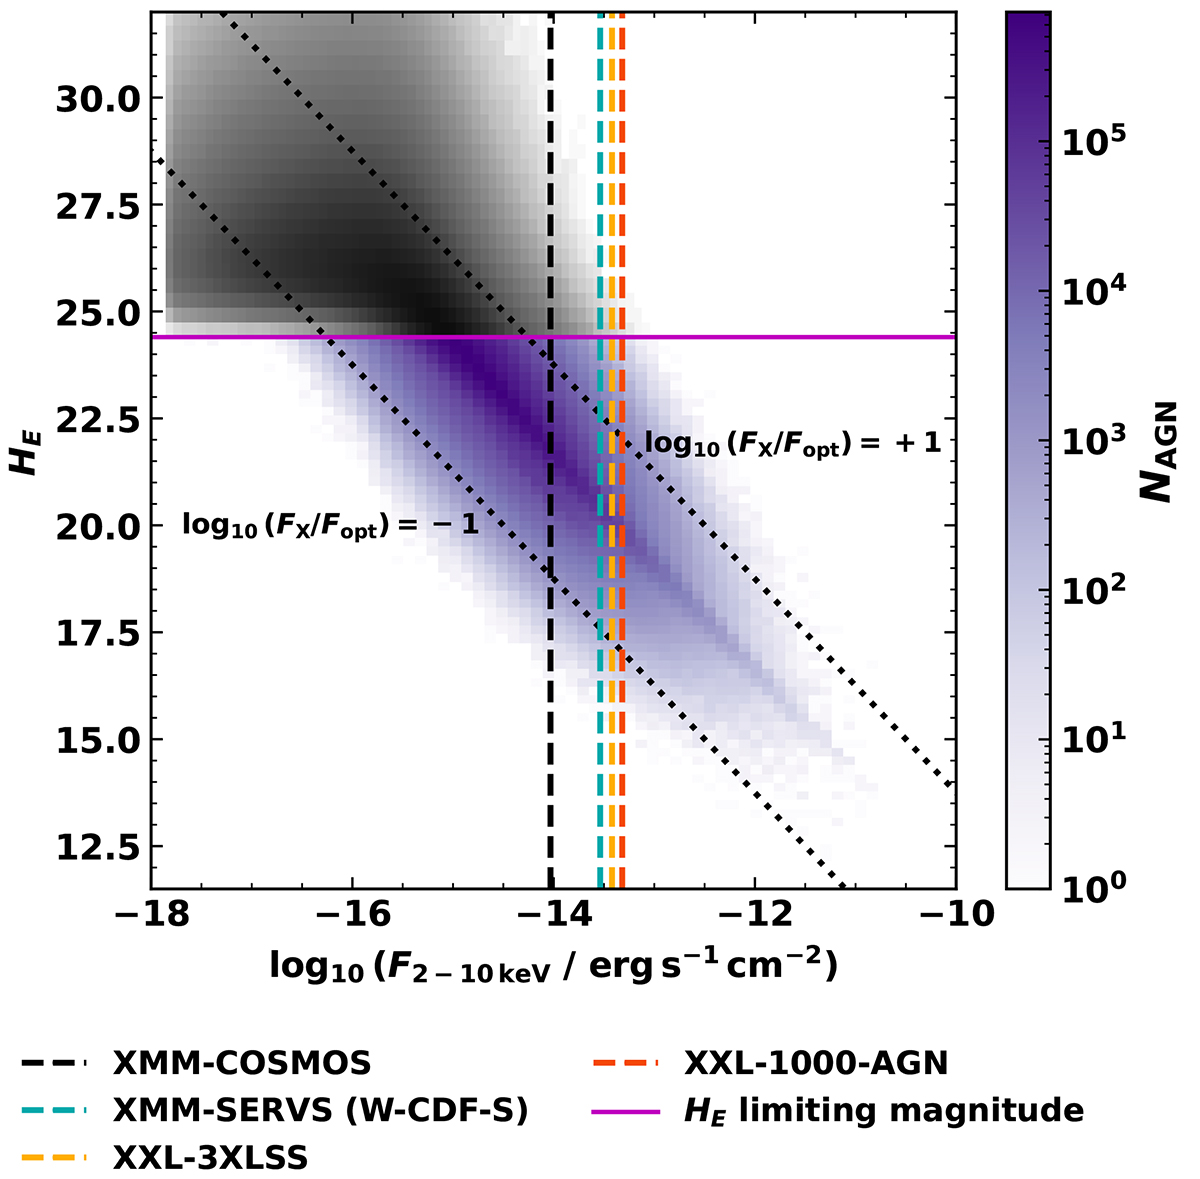
Fig. 15.
Download original image
Density of EWS AGN in the 2–10 keV X-ray flux vs HE observed magnitude parameter space. The Euclid detectable AGN are shown in purple, whilst undetectable AGN are represented in grey. The AGN population detectable with Euclid photometry will, in part, reside beyond the X-ray flux limits of current X-ray surveys. There is also a portion of parameter space where a population of AGN detectable in modern X-ray surveys remain undetectable in the EuclidHE band. X-ray flux limits for the XMM-COSMOS (black; 90% completeness, F2 − 10 keV = 9.3 × 10⁻¹⁵ erg s−1 cm−2; Cappelluti et al. 2009), XXL-3XLSS (orange; 90% completeness, F2 − 10 keV = 3.8 × 10⁻¹⁴ erg s−1 cm−2; Chiappetti et al. 2018), the XMM-SERVS W-CDF-S field (blue; 90% of total area, F2 − 10 keV = 2.9 × 10⁻¹⁴ erg s−1 cm−2; Ni et al. 2021) surveys, and the XXL 1000 brightest AGN sample (XXL-1000-AGN) as used in Fotopoulou et al. (2016b) for SED fitting (red; sample flux limit, F2 − 10 keV = 4.8 × 10⁻¹⁴ erg s−1 cm−2; Fotopoulou et al. 2016b) are plotted for reference. The dotted black lines represent log10(FX/Fopt) = ± 1. The majority of AGN should lie between these lines.
Current usage metrics show cumulative count of Article Views (full-text article views including HTML views, PDF and ePub downloads, according to the available data) and Abstracts Views on Vision4Press platform.
Data correspond to usage on the plateform after 2015. The current usage metrics is available 48-96 hours after online publication and is updated daily on week days.
Initial download of the metrics may take a while.