Fig. 12
Download original image
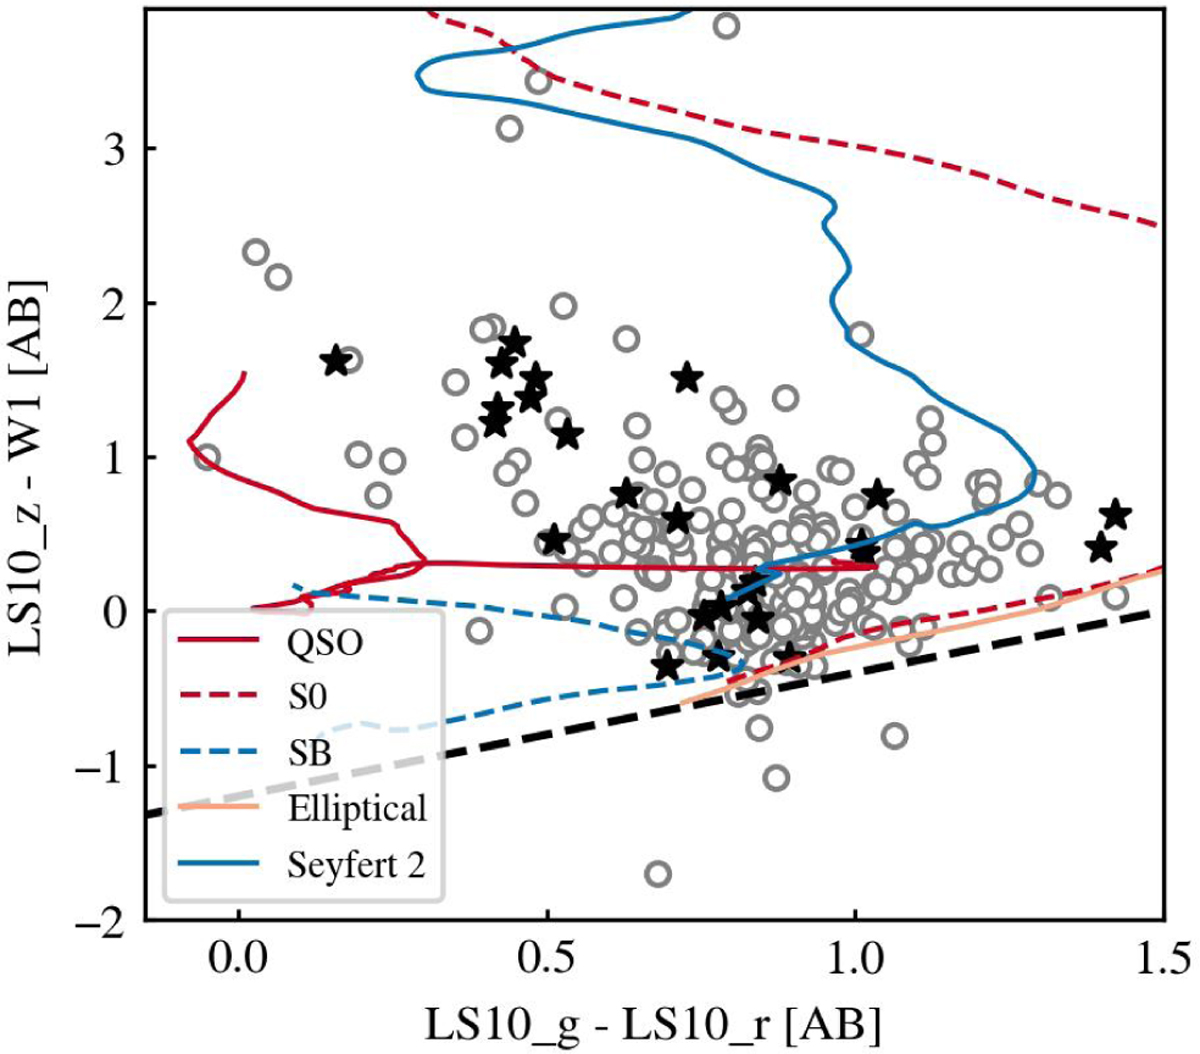
Distribution of 226 eRO-ExTra sources with reliable counterparts (p_any > 0.17) and accurately measured LS10 fluxes in z-W1 vs. 𝑔-r plane. Black stars indicate the radio-detected sources. Tracks of active and inactive galaxies are included and described in the figure legend. The black dashed line (z–W1–0.8×(𝑔 – r)+1.2=0) marks the division between Galactic (below) and extragalactic (above) sources. The theoretical tracks and the marked division between Galactic and extragalactic sources are both from Salvato et al. (2022).
Current usage metrics show cumulative count of Article Views (full-text article views including HTML views, PDF and ePub downloads, according to the available data) and Abstracts Views on Vision4Press platform.
Data correspond to usage on the plateform after 2015. The current usage metrics is available 48-96 hours after online publication and is updated daily on week days.
Initial download of the metrics may take a while.