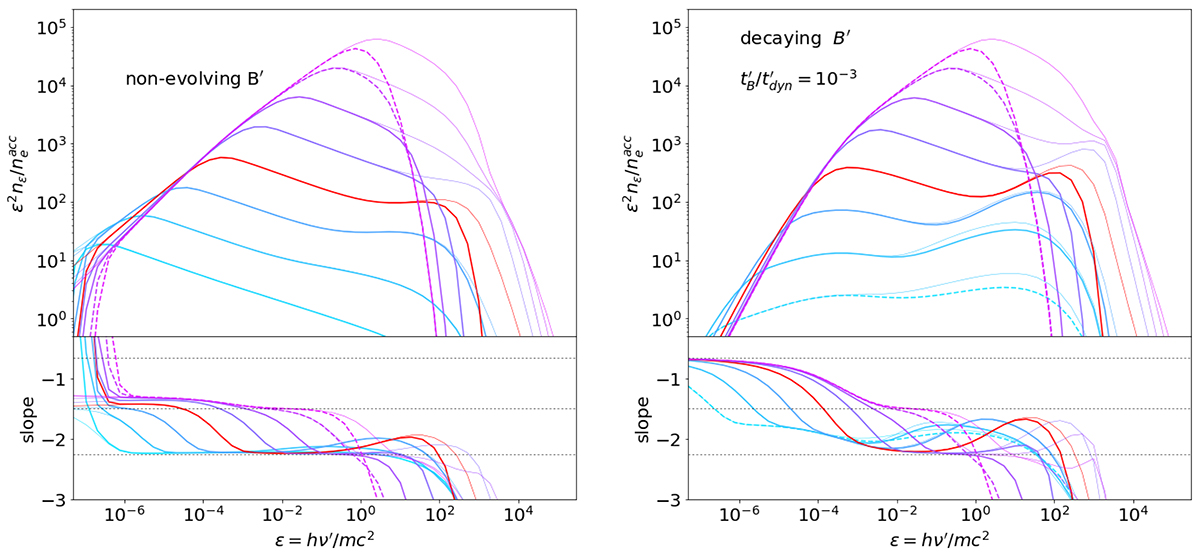
Fig. 4.
Download original image
Emission in the co-moving frame: Effect of the electron Lorentz factor. Starting from the reference case shown in red (Γm = 1600, B′0 = 2000 G, ne, acc = 4.1 × 107 cm−3, tdyn = 80 s), we plot the evolution of the spectrum when varying the electron Lorentz factor, either assuming a constant (left) or a decaying (right) magnetic field. The adopted values are Γm = 51 (cyan), 160, 510, 1600, 5100, 1.6 × 10⁴, 5 × 10⁴, and 1.6 × 10⁵ (magenta). The spectra obtained when pair production and synchrotron self-absorption are not included are shown with thin lines. Dashed lines show the spectra that do not satisfy the conditions for transparency (τT < 0.1) or that are radiatively inefficient (frad < 50%).
Current usage metrics show cumulative count of Article Views (full-text article views including HTML views, PDF and ePub downloads, according to the available data) and Abstracts Views on Vision4Press platform.
Data correspond to usage on the plateform after 2015. The current usage metrics is available 48-96 hours after online publication and is updated daily on week days.
Initial download of the metrics may take a while.