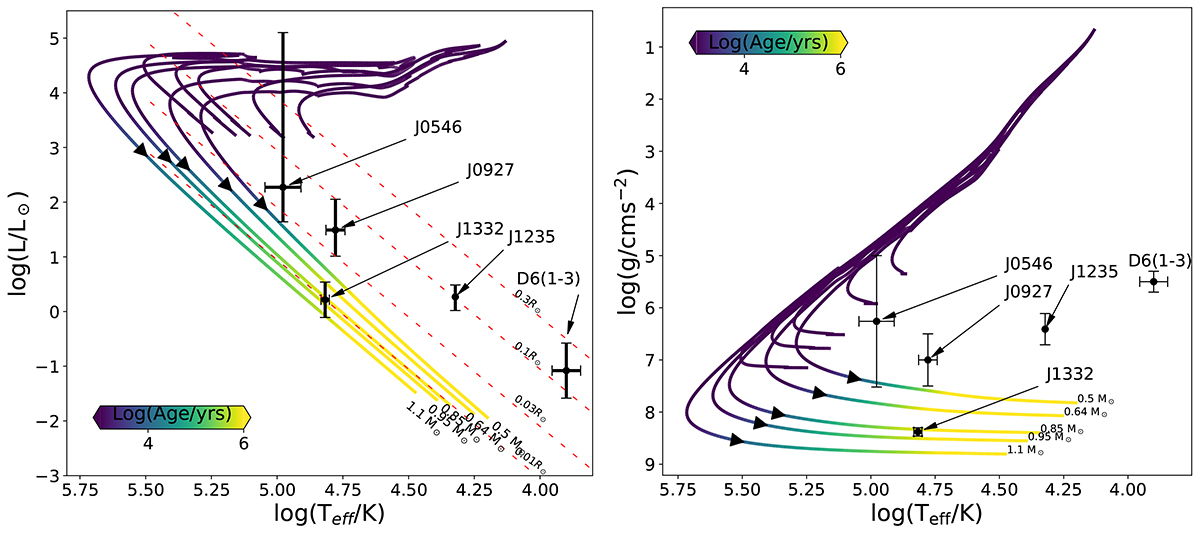
Fig. 12.
Download original image
Evolutionary tracks for all WD models. Left panel: HR diagram for all WD models. All observed D6 stars are plotted as black points. The dashed red lines represent the lines of constant radii. The colour bar shows the log(age) of the star. The arrows mark the points when the model is 104 years old. Right panel: Kiel diagram for the same model. The high uncertainty in J0546 comes from combining the minimum and maximum values from Werner et al. (2024) and El-Badry et al. (2023), which have different ways of measuring the radius that lead to inconsistent results.
Current usage metrics show cumulative count of Article Views (full-text article views including HTML views, PDF and ePub downloads, according to the available data) and Abstracts Views on Vision4Press platform.
Data correspond to usage on the plateform after 2015. The current usage metrics is available 48-96 hours after online publication and is updated daily on week days.
Initial download of the metrics may take a while.