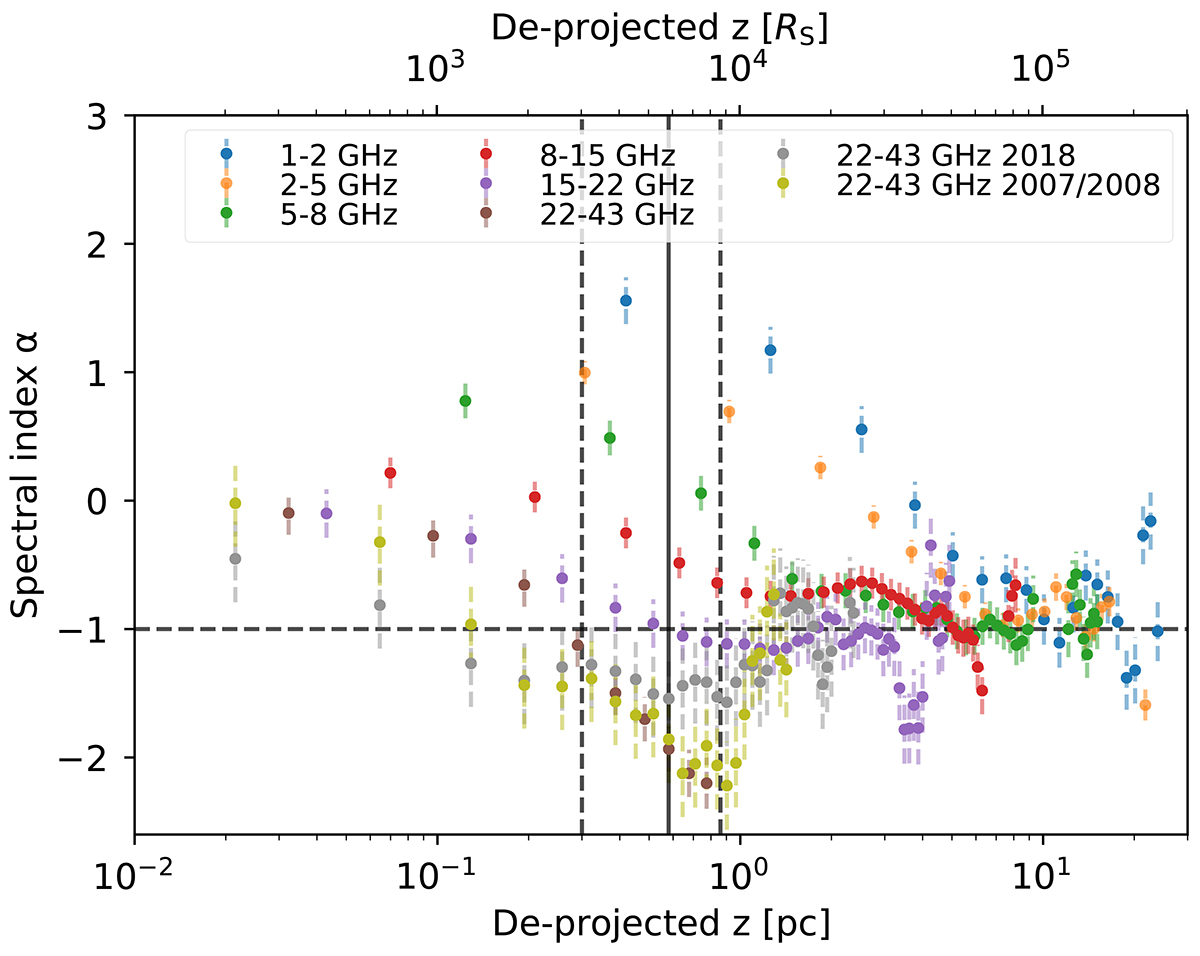
Fig. 5.
Download original image
Average spectral index as a function of distance from the 43 GHz core for different pairs of frequencies. In addition to the VLBA data set here presented, we re-present for comparison the 22–43 GHz spectral index values for the two epochs presented by Ricci et al. (2022). At high frequencies, remarkably steep spectral index values down to α ∼ −2 are observed within one parsec from the core, corresponding to ∼104 RS. Downstream, a convergence toward flatter values α ∼ −0.8 is observed at all frequencies. The black vertical lines highlight the jet break point, as proposed in Boccardi et al. (2021), while the horizontal dashed line is set at α = −1 as reference.
Current usage metrics show cumulative count of Article Views (full-text article views including HTML views, PDF and ePub downloads, according to the available data) and Abstracts Views on Vision4Press platform.
Data correspond to usage on the plateform after 2015. The current usage metrics is available 48-96 hours after online publication and is updated daily on week days.
Initial download of the metrics may take a while.