Fig. 11
Download original image
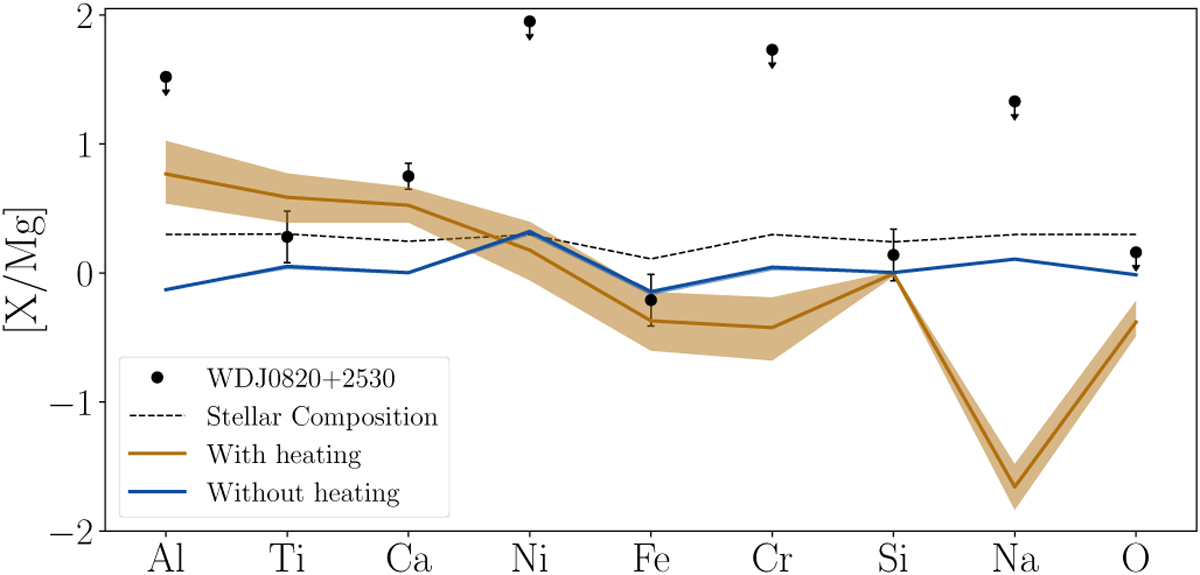
Comparison of abundances of WD and the MS star using optical data. Abundances are shown relative to Mg, and normalised to Solar composition on a log scale. The model with the highest Bayesian evidence, which includes heating, is shown in orange. This model also includes a feeding zone. The best model which does not include heating is shown in blue. This model cannot fit the data well, and so is heavily disfavoured. The small confidence interval for the non-heating model is due to its limited number of free parameters, mostly fixed or tightly constrained.
Current usage metrics show cumulative count of Article Views (full-text article views including HTML views, PDF and ePub downloads, according to the available data) and Abstracts Views on Vision4Press platform.
Data correspond to usage on the plateform after 2015. The current usage metrics is available 48-96 hours after online publication and is updated daily on week days.
Initial download of the metrics may take a while.