Fig. 12
Download original image
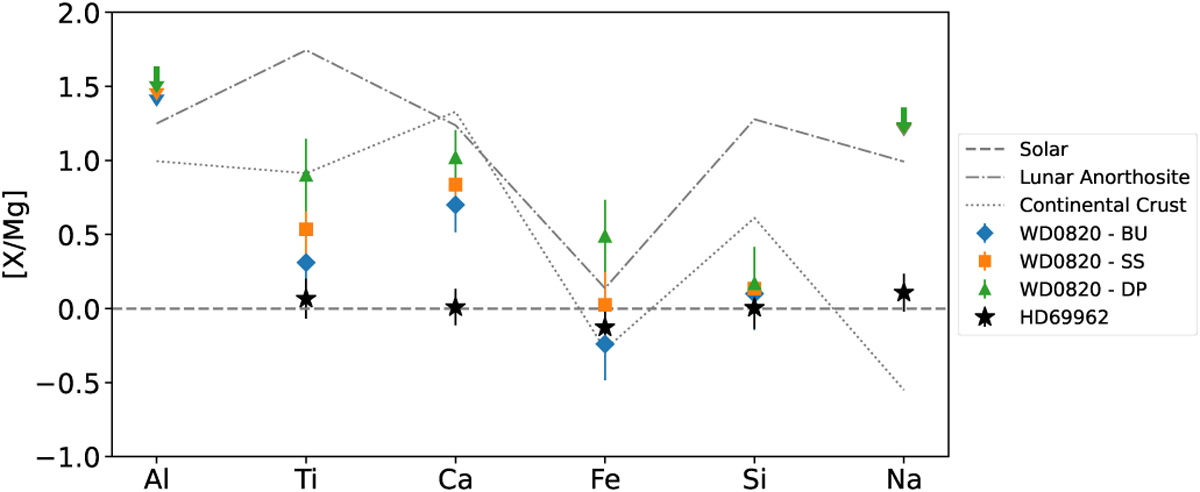
Comparison of the MS and WD abundances in different accretion phases, including the typical composition of continental crustal material (dotted line) and Lunar anorthosite (dot-dashed lines). These abundances are normalized to Solar values. Downward arrows in this figure represent the upper limits measured in the WD atmosphere.
Current usage metrics show cumulative count of Article Views (full-text article views including HTML views, PDF and ePub downloads, according to the available data) and Abstracts Views on Vision4Press platform.
Data correspond to usage on the plateform after 2015. The current usage metrics is available 48-96 hours after online publication and is updated daily on week days.
Initial download of the metrics may take a while.